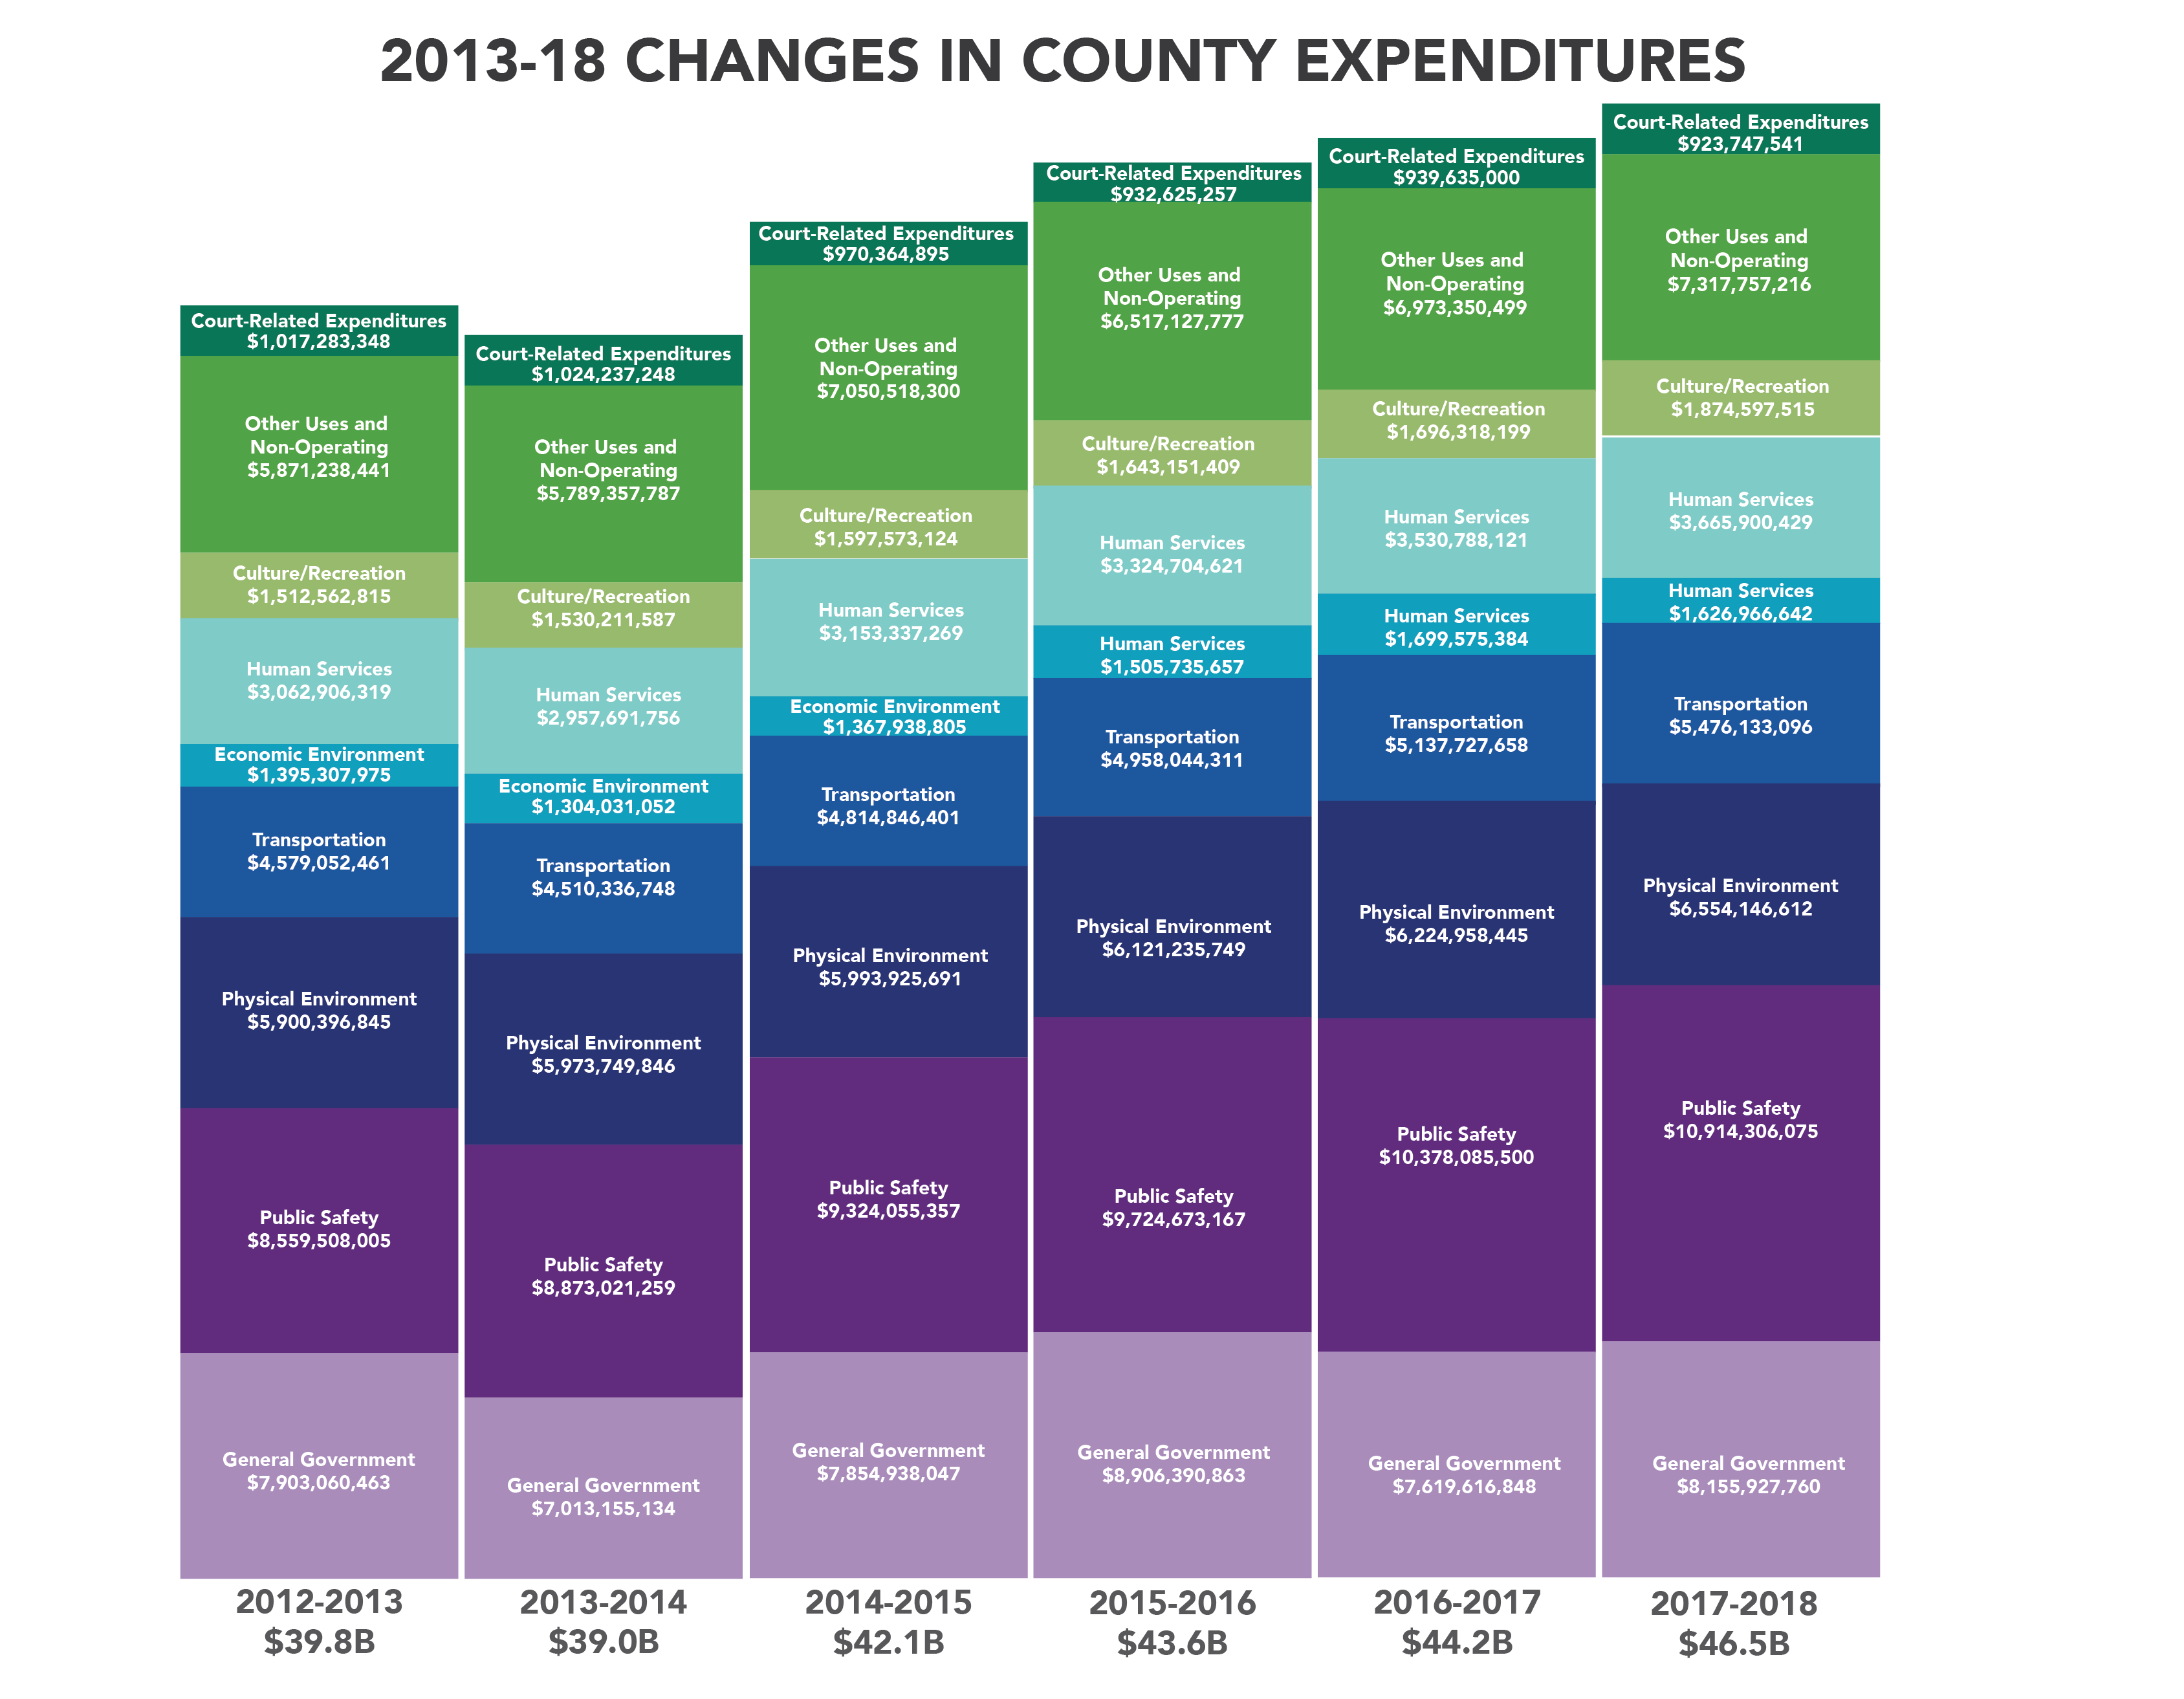
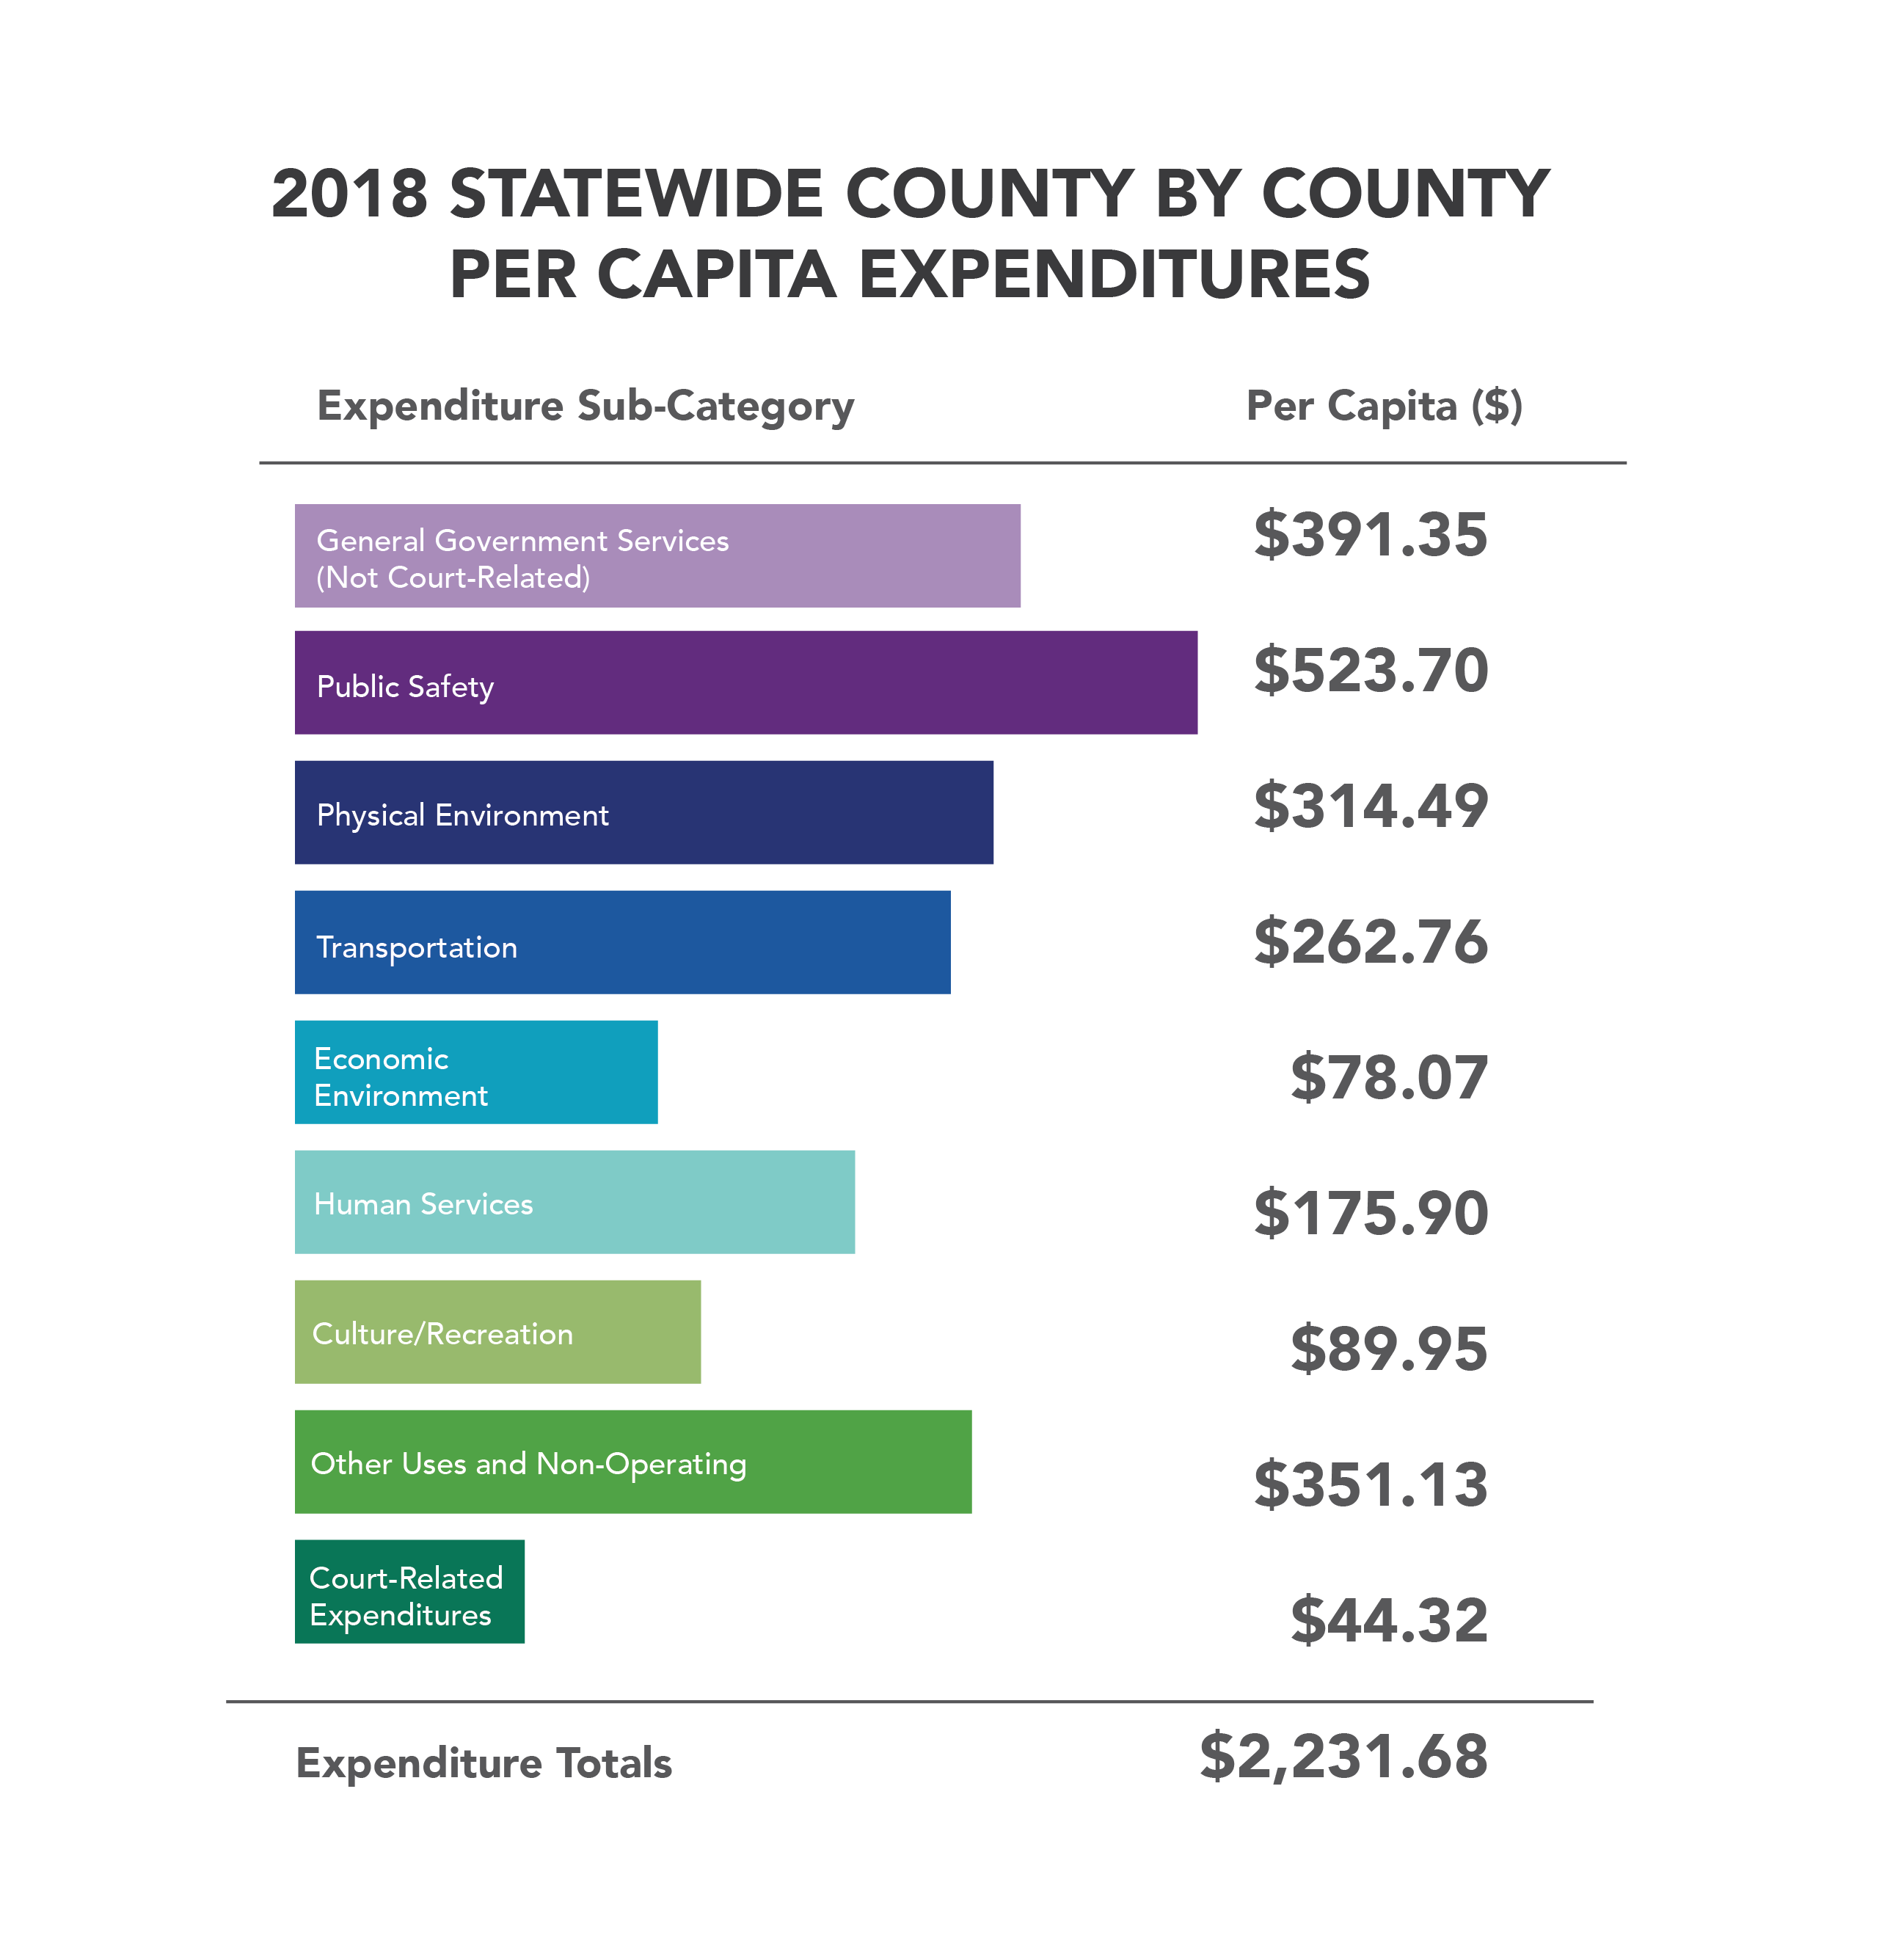
In FY 2018, County expenditures equaled $46,509,482,886. This represents an increase of $2,309,427,232, or 5.22% from the previous fiscal year. The total per capita spending was equal to $2,231.68 per person statewide. This represents an increase of $73.91 per person statewide, or 3.43% from the previous fiscal year.
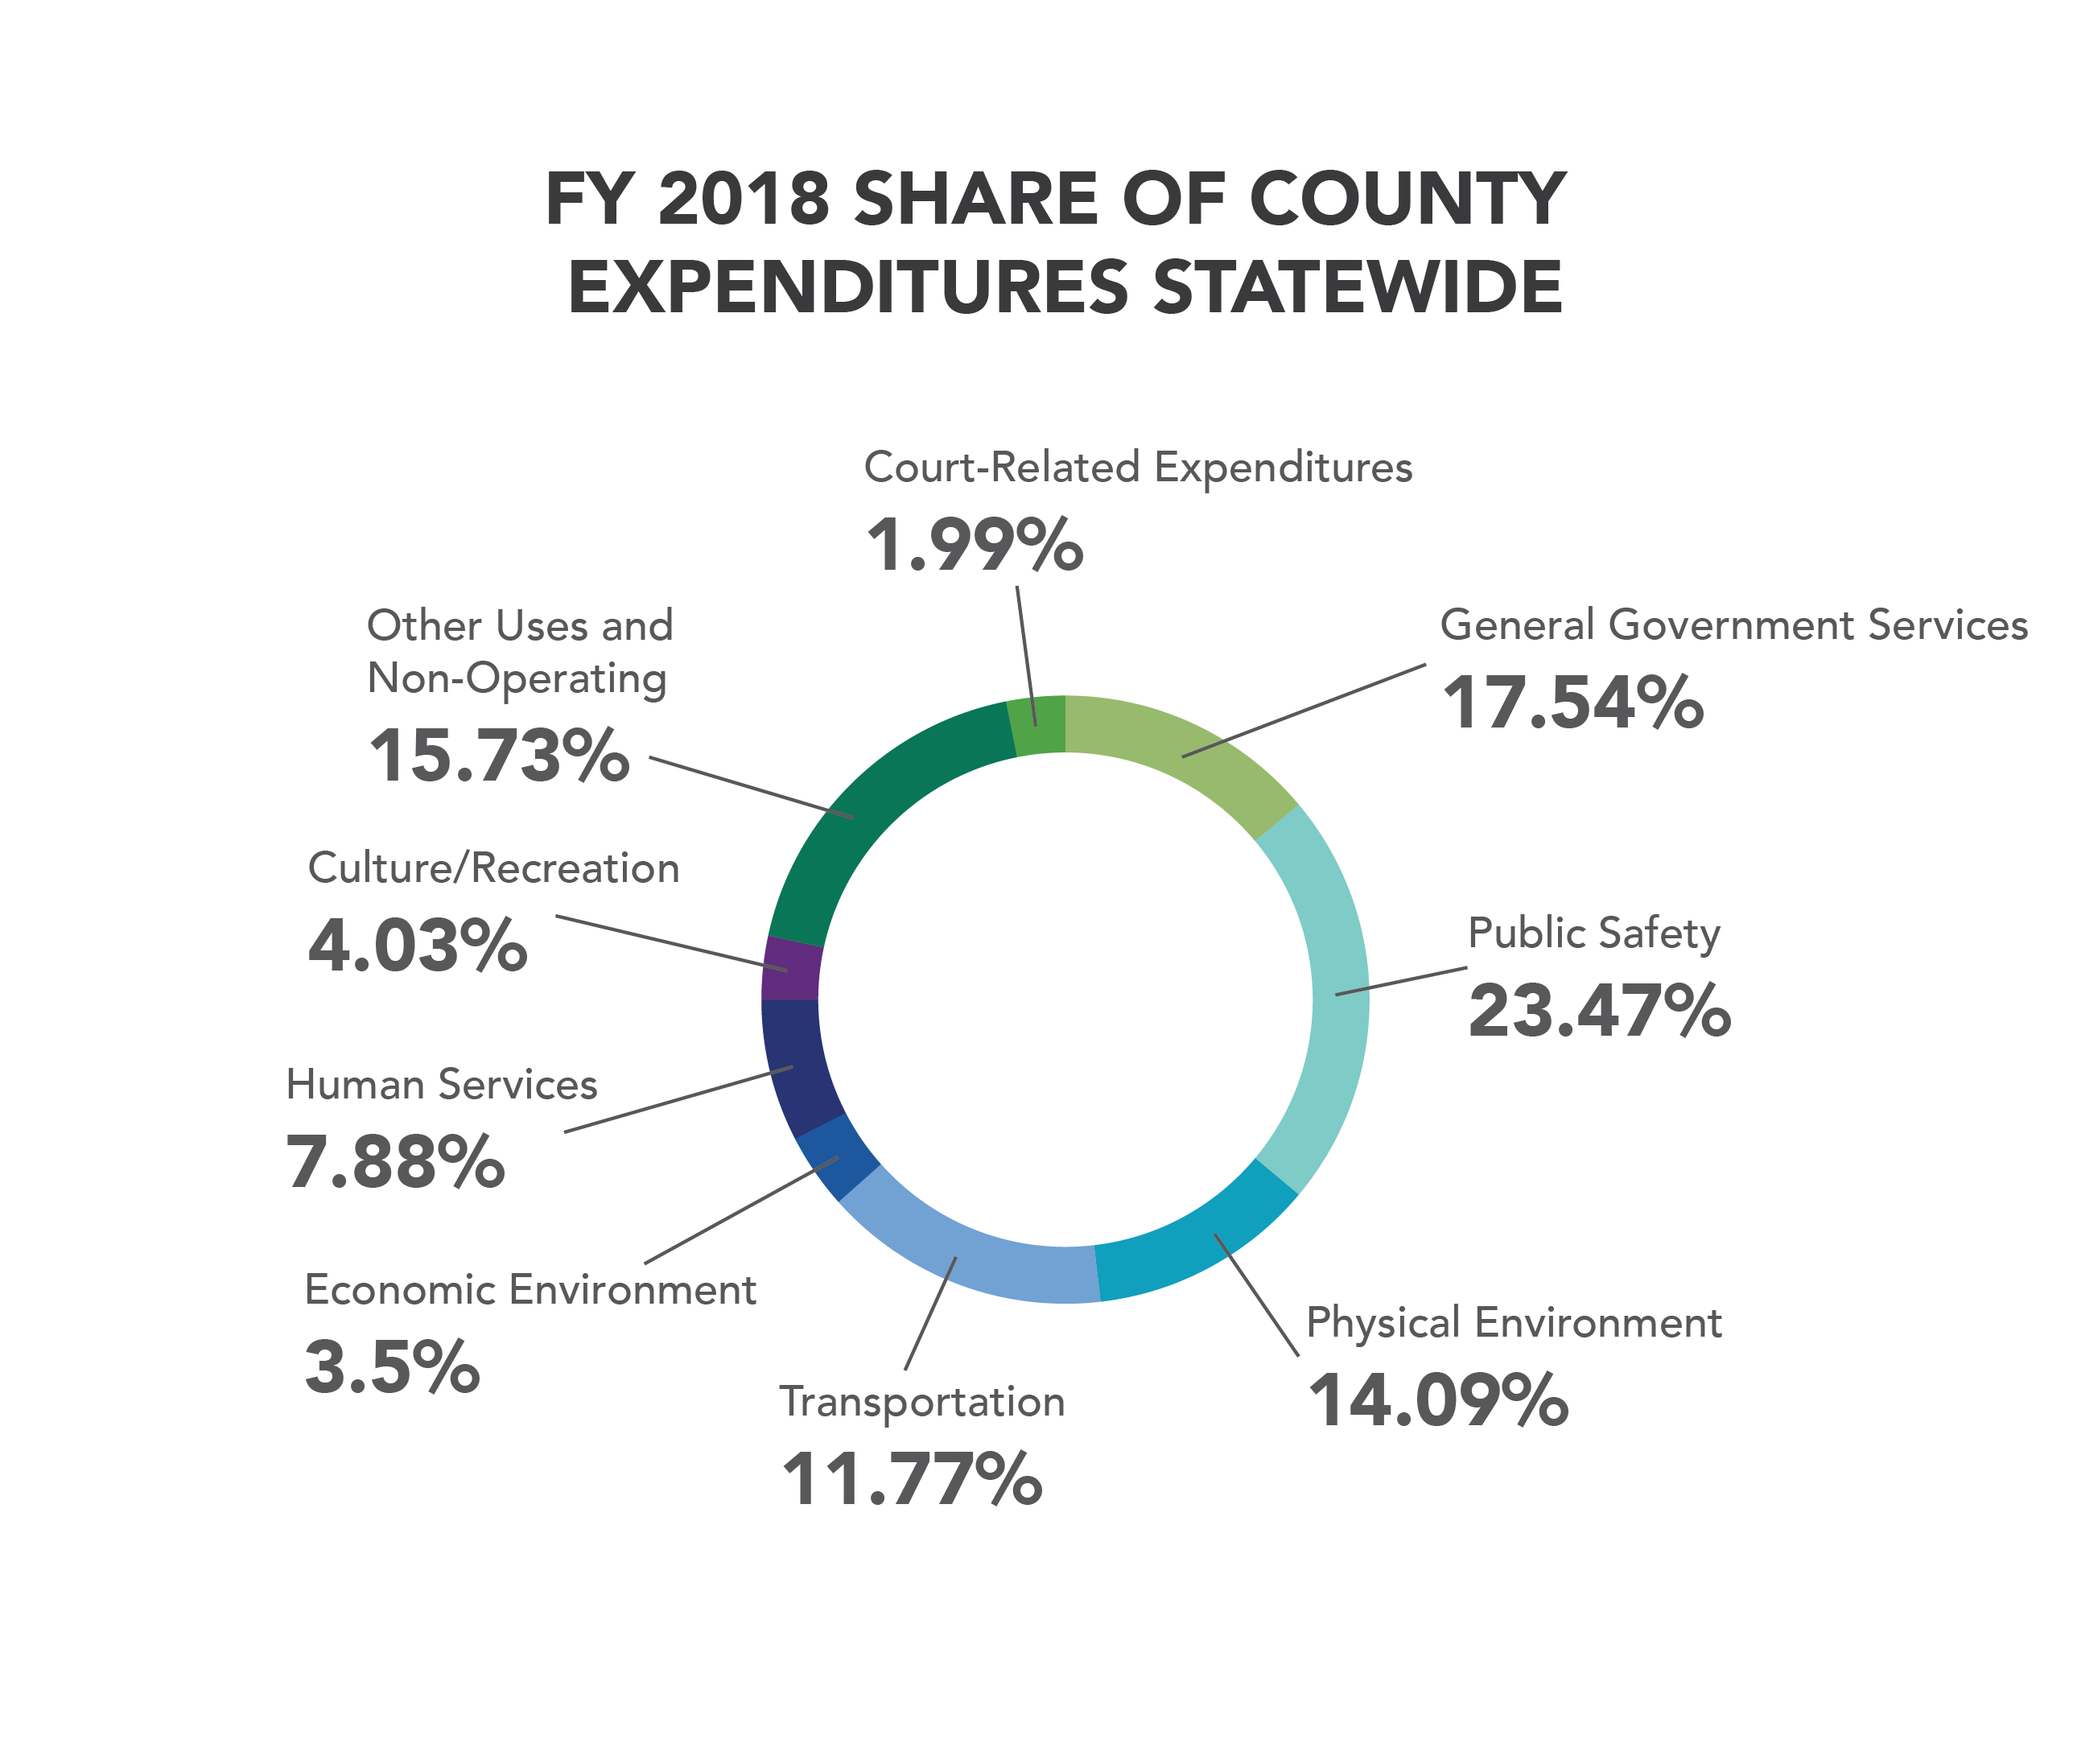
The majority of county spending was concentrated within five expenditure categories statewide: Public Safety, General Government, Other Uses & Non-Operating, Physical Environment, and Transportation. These five categories accounted for about 83% of total statewide county spending, $1,843.44 in per capita expenditures for FY 2018.
Over the last 5 years, FY 2013 to FY 2018, the proportion of the total expenditures for each expenditure sub-category remained relatively static. However, the total amount of expenditures overall increased by $6.68 billion statewide. The only exception was General Government expenditures during FY 2013-14 and FY 2016-17, which dropped 2% as a share of total expenditures for each of those fiscal years.
In FY 2018, almost one quarter of all county expenditures (23.47%) were related to Public Safety. The total per capita spending for Public Safety expenditures was $523.70. On a year-byyear basis, the total per capita spending statewide for Public Safety expenditures increased by $17.06, an increase of 3.37%.
General Government expenditures accounted for the second highest expenditure category at 17.54%, while Other Uses & Non-Operating expenditures followed at 15.73% of statewide County expenditures. The total per capita spending for General Government expenditures was $391.35 and $351.13 for Other Uses & Non-Operating expenditures. On a year-by-year basis, the total per capita spending statewide for General Government expenditures increased by $19.37, an increase of 5.21%; while Other Uses & Non-Operating expenditures increased by $10.70, an increase of 3.14%.
Physical Environment expenditures accounted for the fourth highest expenditure category at 14.09% and Transportation expenditures were fifth highest at 11.77% of statewide County expenditures. The total per capita spending for Physical Environment expenditures was $314.49 and $262.76 for Transportation expenditures. On a year-by-year basis, the total per capita spending statewide for Physical Environment expenditures increased by $10.60, an increase of 3.49%; while Transportation expenditures increased by $11.95, an increase of 4.76%.
The bottom four expenditure categories of Human Services, Culture & Recreation, Economic Environment, and Court-Related spending collectively accounted for 17.40% of total County expenditures. The total per capita spending for Human Services, Economic Environment, Culture & Recreation, and Court-Related was $175.90, $78.07, $89.95, and $44.32 respectively. On a year-by-year basis, the total per capita spending statewide for Human Services expenditures increased by $3.54, an increase of 2.05%; while Culture & Recreation expenditures increased by $7.14, an increase of 8.62%. However, two expenditure categories, Economic Environment and Court-Related expenditures decreased in total per capita spending statewide on a year- by-year basis. The total per capita spending statewide decreased by $4.90 and $1.55, a reduction of 5.91% and 3.37% respectively.