2021 County Revenues & Expenditures: Culture & Recreation
Cultural Affairs and Parks enhance the quality of life of a community and provide safe places for children and adults to enrich, exercise, play, and socialize. Arts and Culture funding creates jobs, tourism, and education within the community. Libraries are vital resources to local governments providing equal access to all residents that offer opportunities for growth, development, and curiosity. Outdoor recreation and public parks preserve and maintain the ecological health and beauty of communities.
In FY 2018, Culture & Recreation expenditures accounted for $1,874,597,515, or 4.03% of all statewide expenditures for Florida’s counties, the second smallest expenditure category. The statewide average percentage share was equal to 3.54%, when comparing Culture & Recreation expenses to all expenditures on a county-by-county basis.

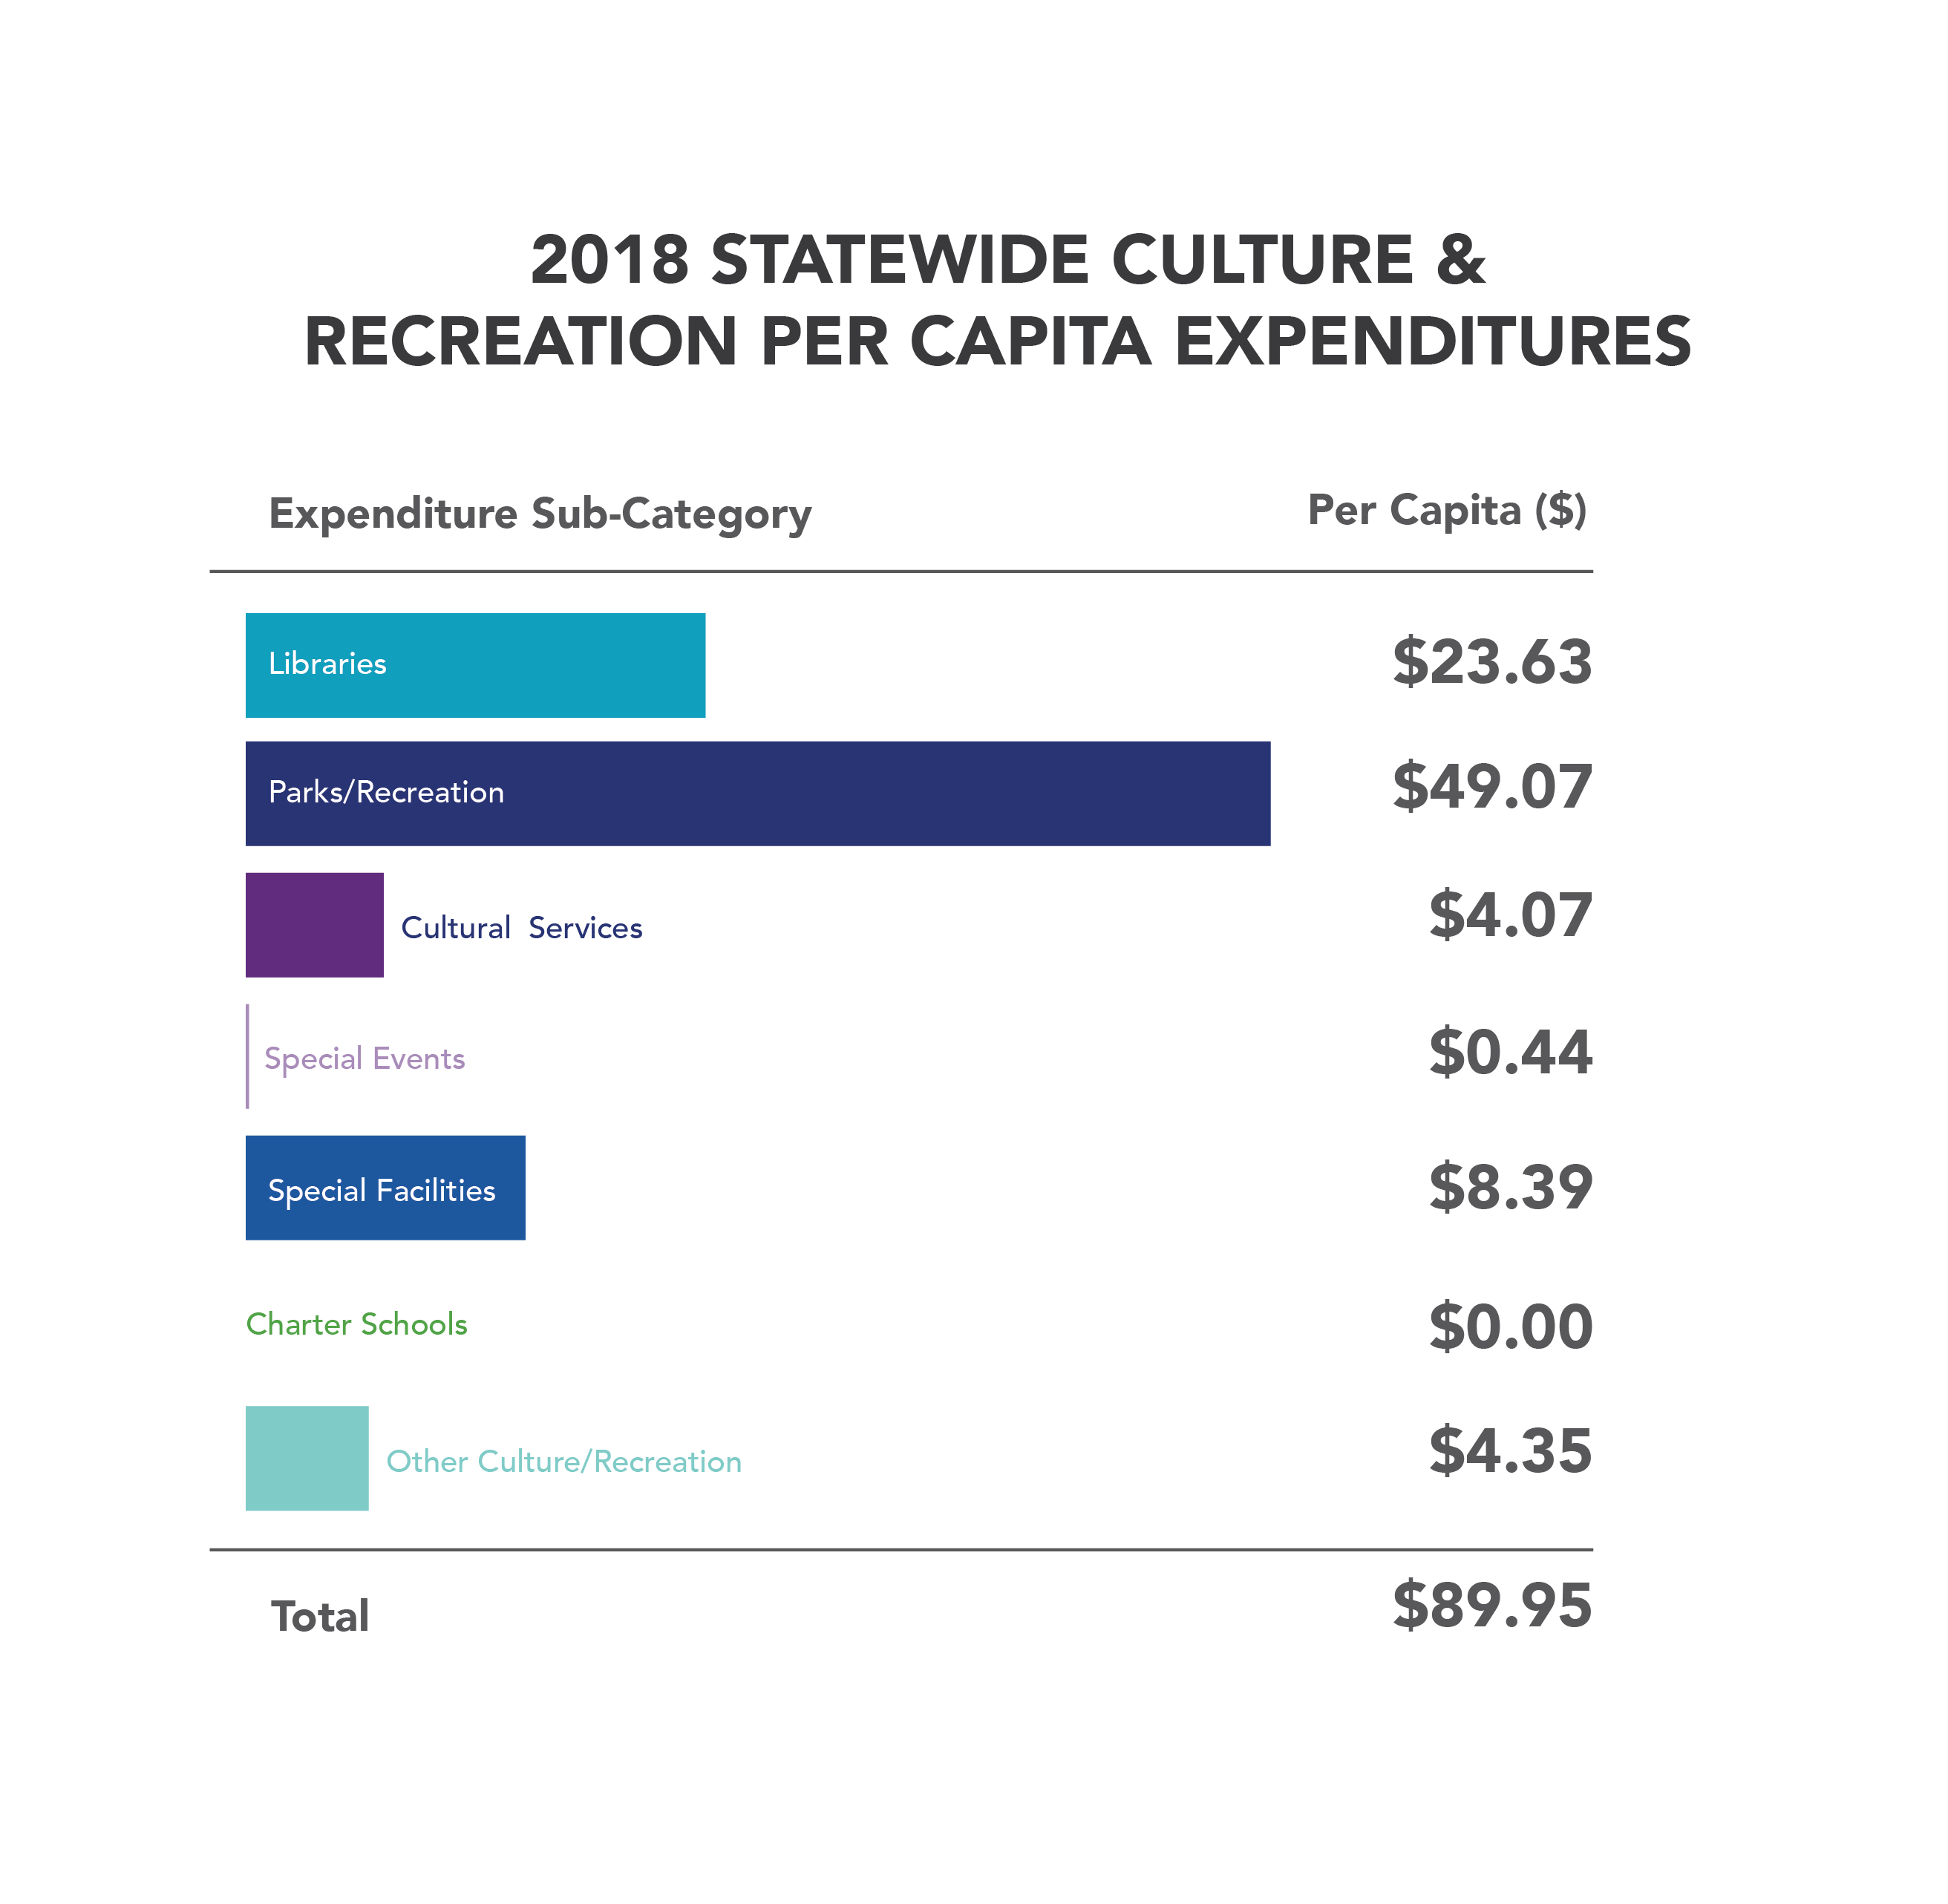
The total per capita spending for Culture & Recreation expenditures was equal to $89.95 per person statewide. This represents an increase of $178,279,316 , or 10.51% from the previous fiscal year. The total per capita spending for Culture & Recreation expenditures increased by $7.14, or 8.62% from the previous fiscal year.

The majority of Culture & Recreation spending was concentrated within two expenditure categories statewide: Parks & Recreation and Libraries expenditures. These two categories accounted for about 81% of total Culture & Recreation spending, $72.70 in per capita expenditures for FY 2018.
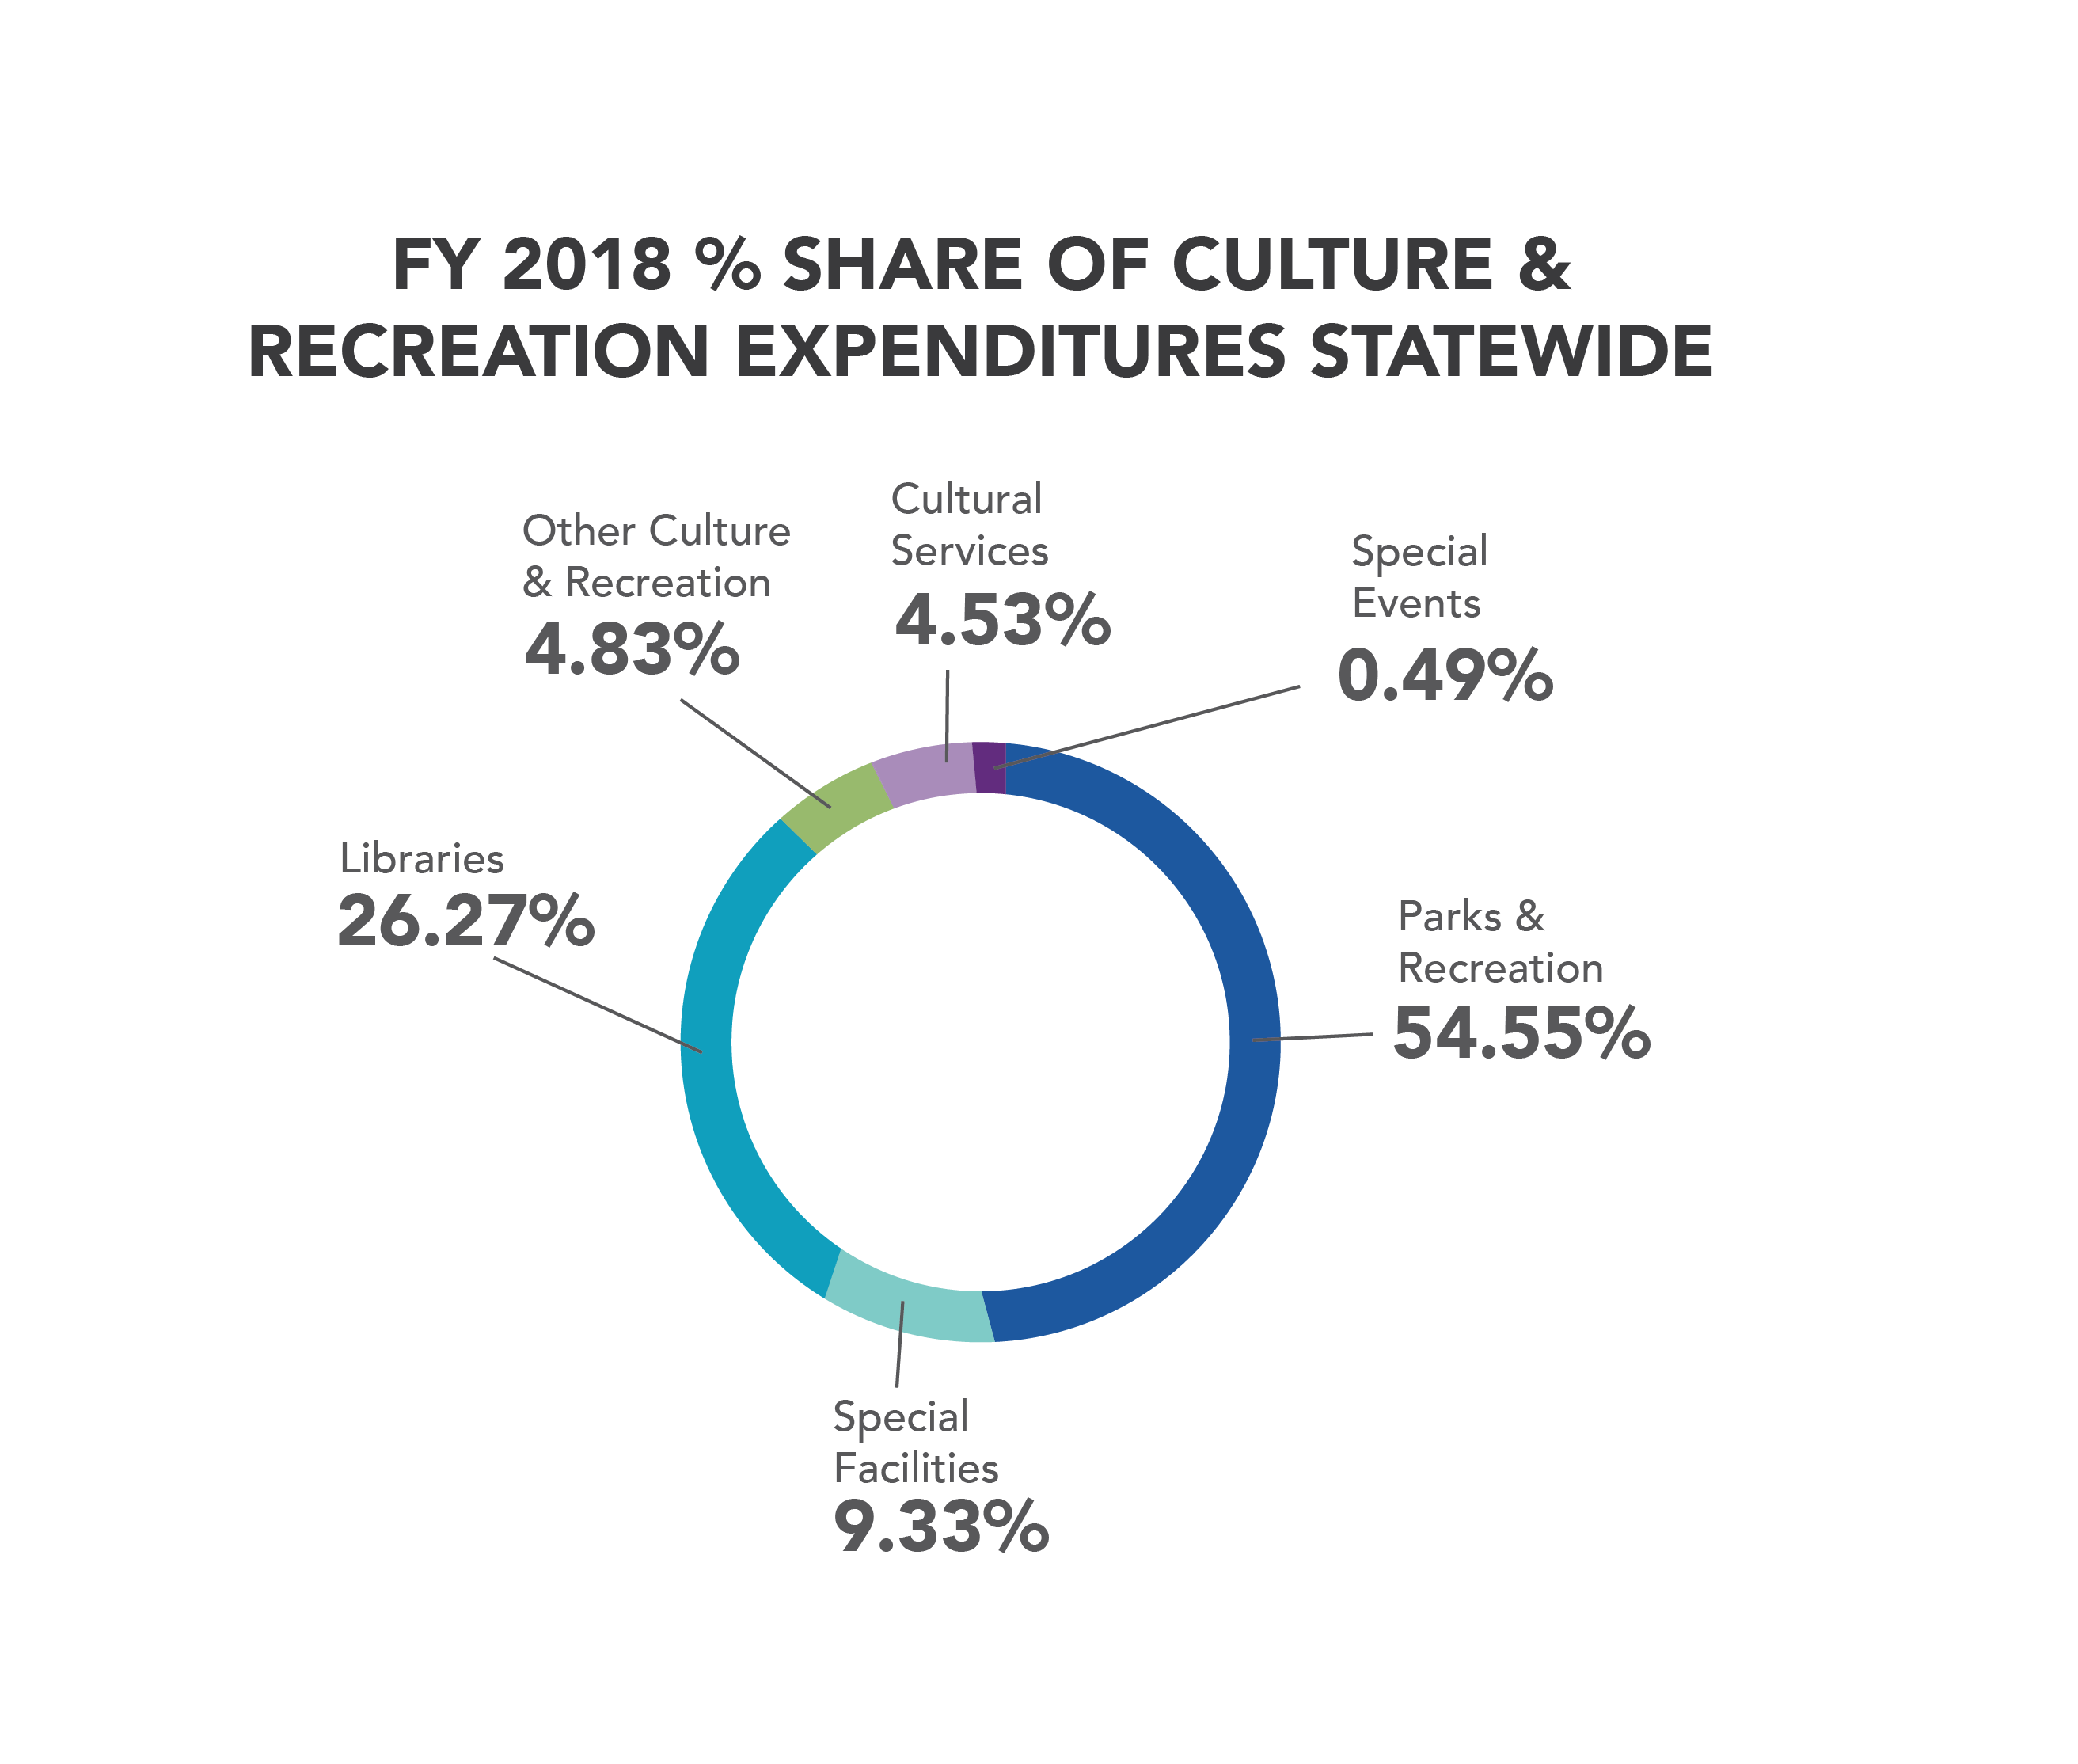
Over half of all Culture & Recreation expenditures (54.55%) were spent on Parks & Recreation. The total per capita spending for Parks & Recreation expenditures was $49.07. Parks & Recreation expenditures include but are not limited to costs associated with the provision of recreation department facilities, Golf courses, Swimming pools, Tennis courts, Public parks, Community center, Camping areas, and Off-highway bicycle paths.
Libraries expenditures accounted for the second highest expenditure category at 26.27%, while Special Facilities expenditures, which account for costs associated with stadiums, auditoriums, civic centers and marinas, followed at 9.33% of statewide Culture & Recreation expenditures. The total per capita spending for Libraries expenditures was $23.63 and $8.39 for Special Facilities expenditures.
The expenditure categories of Culture Services, Special Events, Charter Schools, and Other Culture & Recreation spending collectively accounted for 9.85% of the total Culture & Recreation expenditures. The total per capita spending for Culture Services, Special Events, Charter Schools, and Other Culture & Recreation was $4.07, $0.44, $0.00, and $4.35 respectively.
