2021 County Revenues & Expenditures: General Government
The foundation of a strong democracy is a public that is educated and informed about the decisions of its government. Accessible and accountable county governments are more responsive to the needs of their citizens and result in more engaged and satisfied constituents. Counties work to uphold the trust of their voters and taxpayers by maintaining open and accessible meetings and records; providing timely, informative, and accurate public information; and adhering to the highest standards of administrative and fiscal transparency. Florida’s elected county commissioners are ultimately answerable to their voters for the provision of programs and services and associated funding decisions through general government services.
In FY 2018, General Government expenditures accounted for $8,155,927,760 , or 17.54% of all statewide expenditures for Florida’s counties, the second largest expenditure category.

The statewide average percentage share was equal to 18.31%, when comparing General Government expenses to all expenditures on a county-bycounty basis. The total per capita spending for General Government expenditures was equal to $391.13 per person statewide. This represents an increase of $536,310,912 , or 7.04% from the previous fiscal year. The total per capita spending for General Government expenditures increased by $19.37, or 5.21% from the previous fiscal year.

The majority of General Government spending While Pension Benefits statewide spending was was concentrated within three expenditure categories statewide: Financial and Administrative, Debt Service Payments, and Other General Government Services. These three categories accounted for about 84% of total General Government spending, $330.07in per capita expenditures for FY 2018.
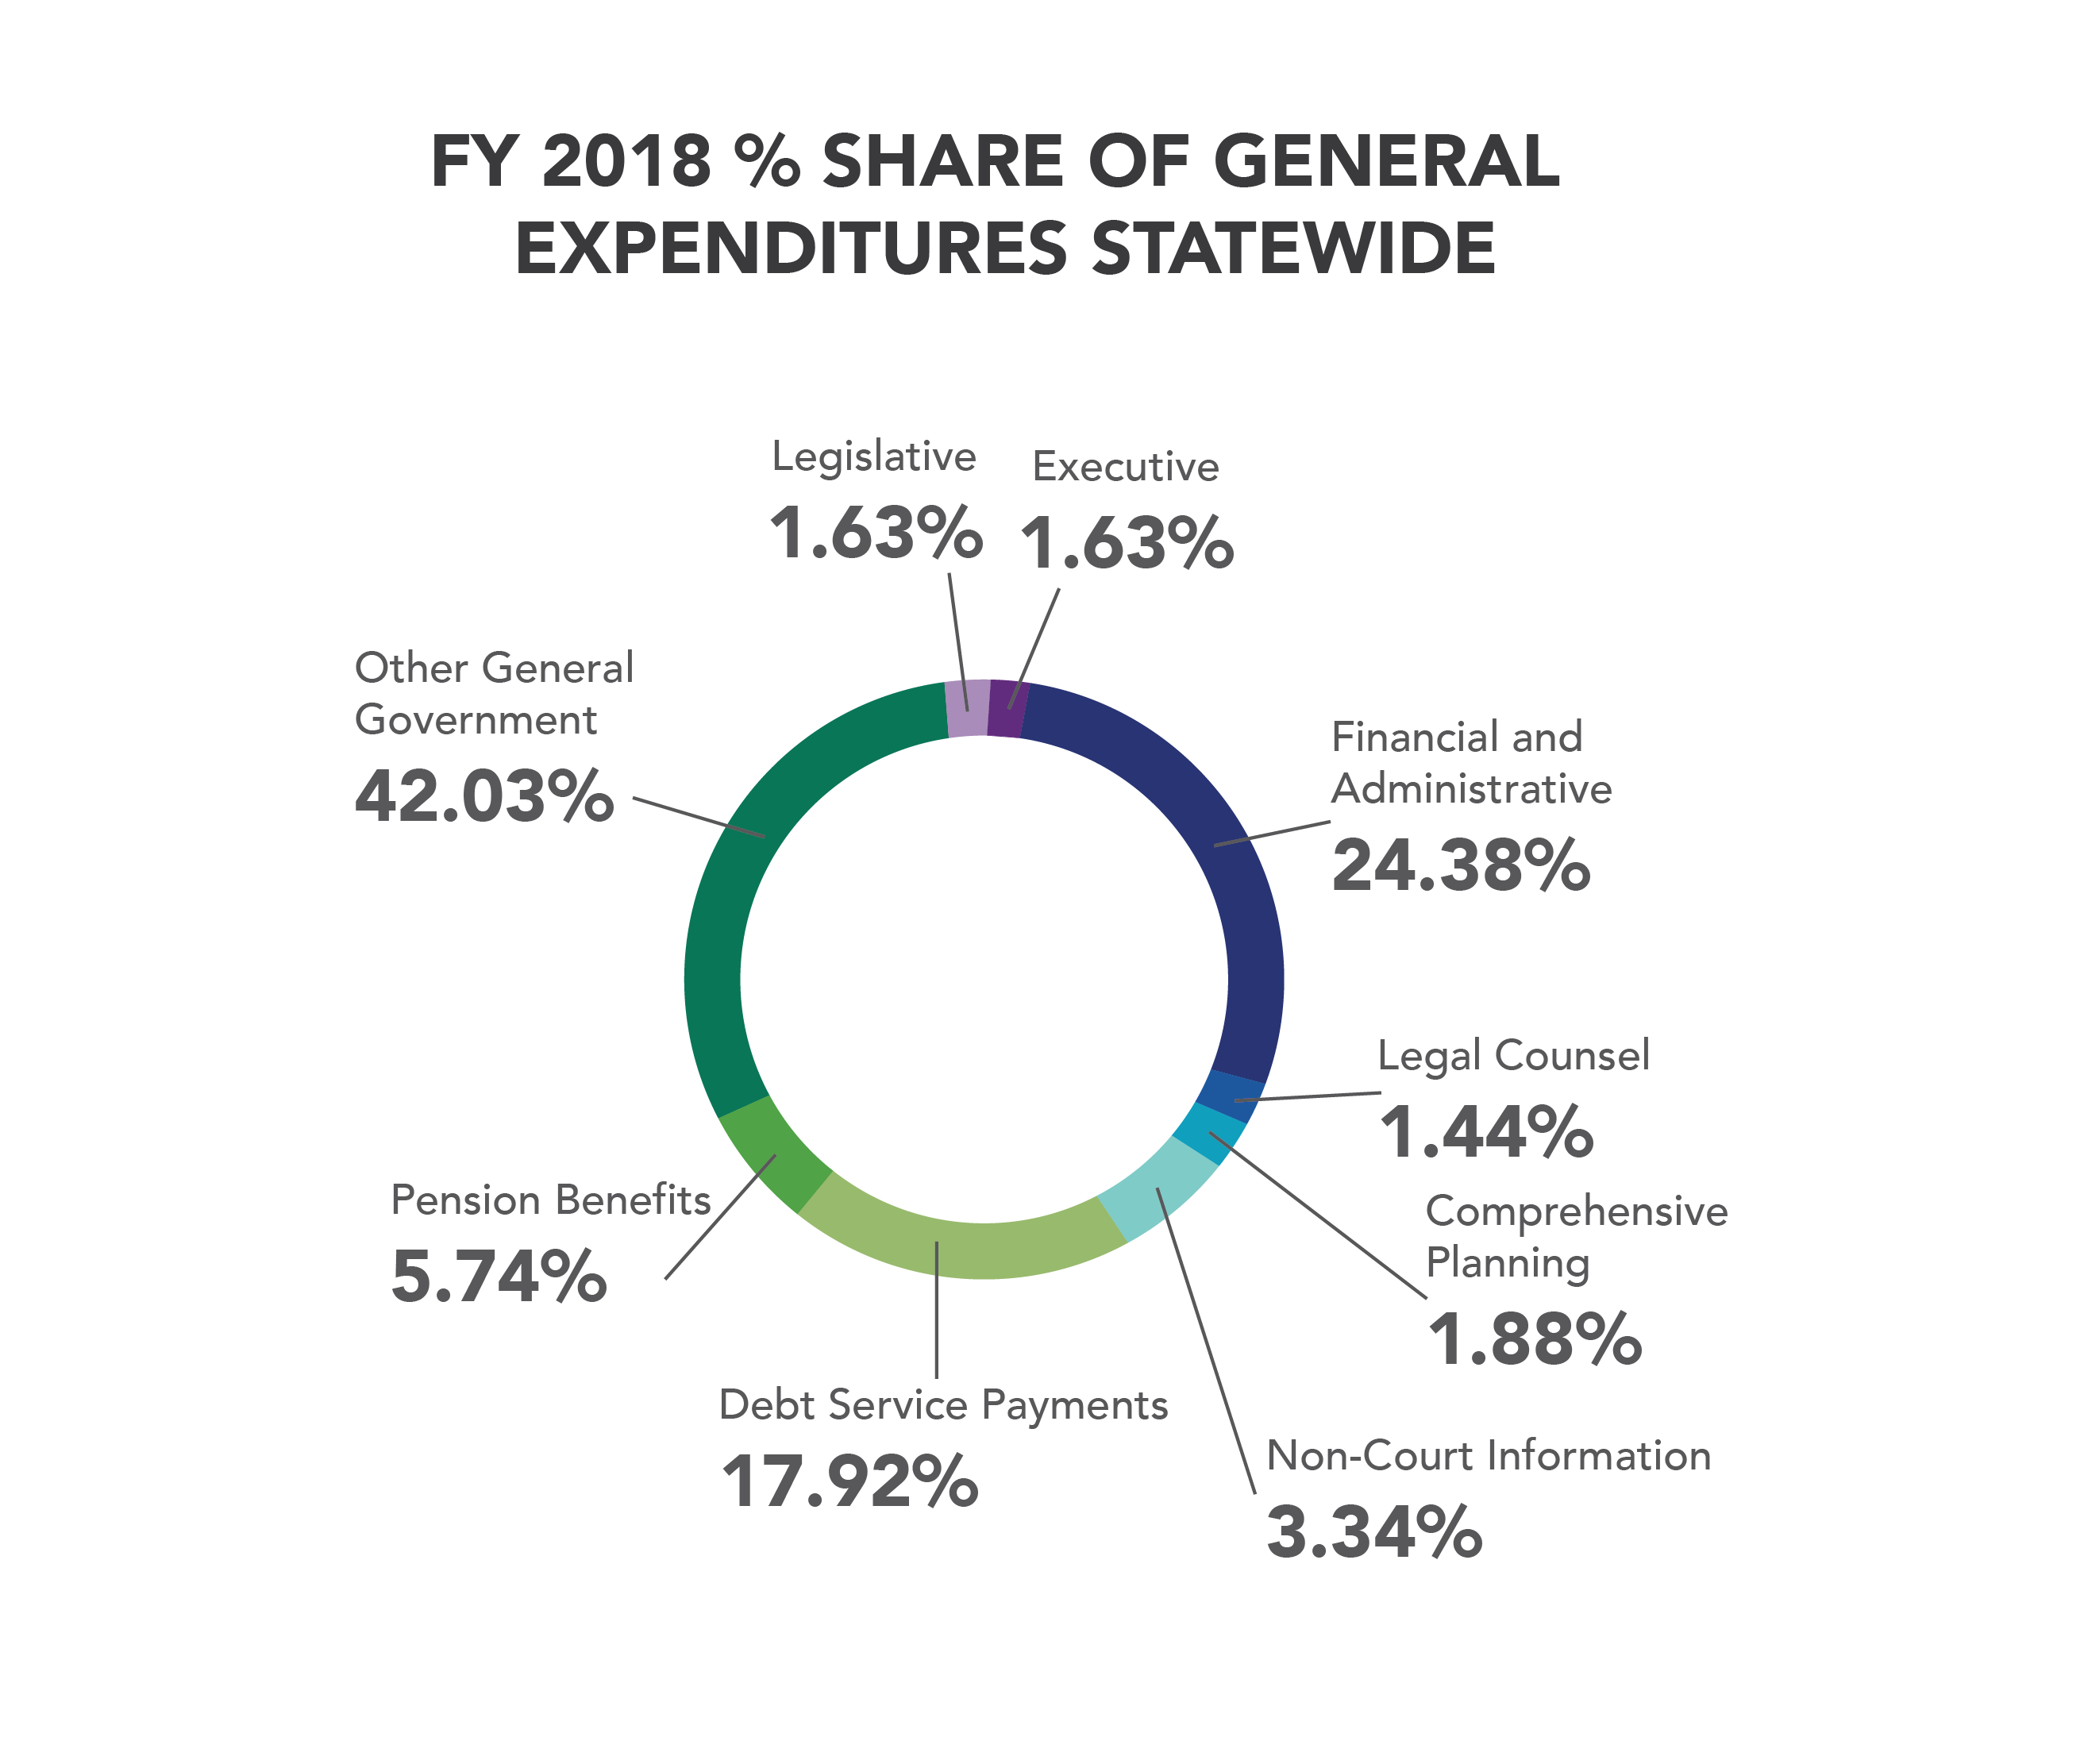
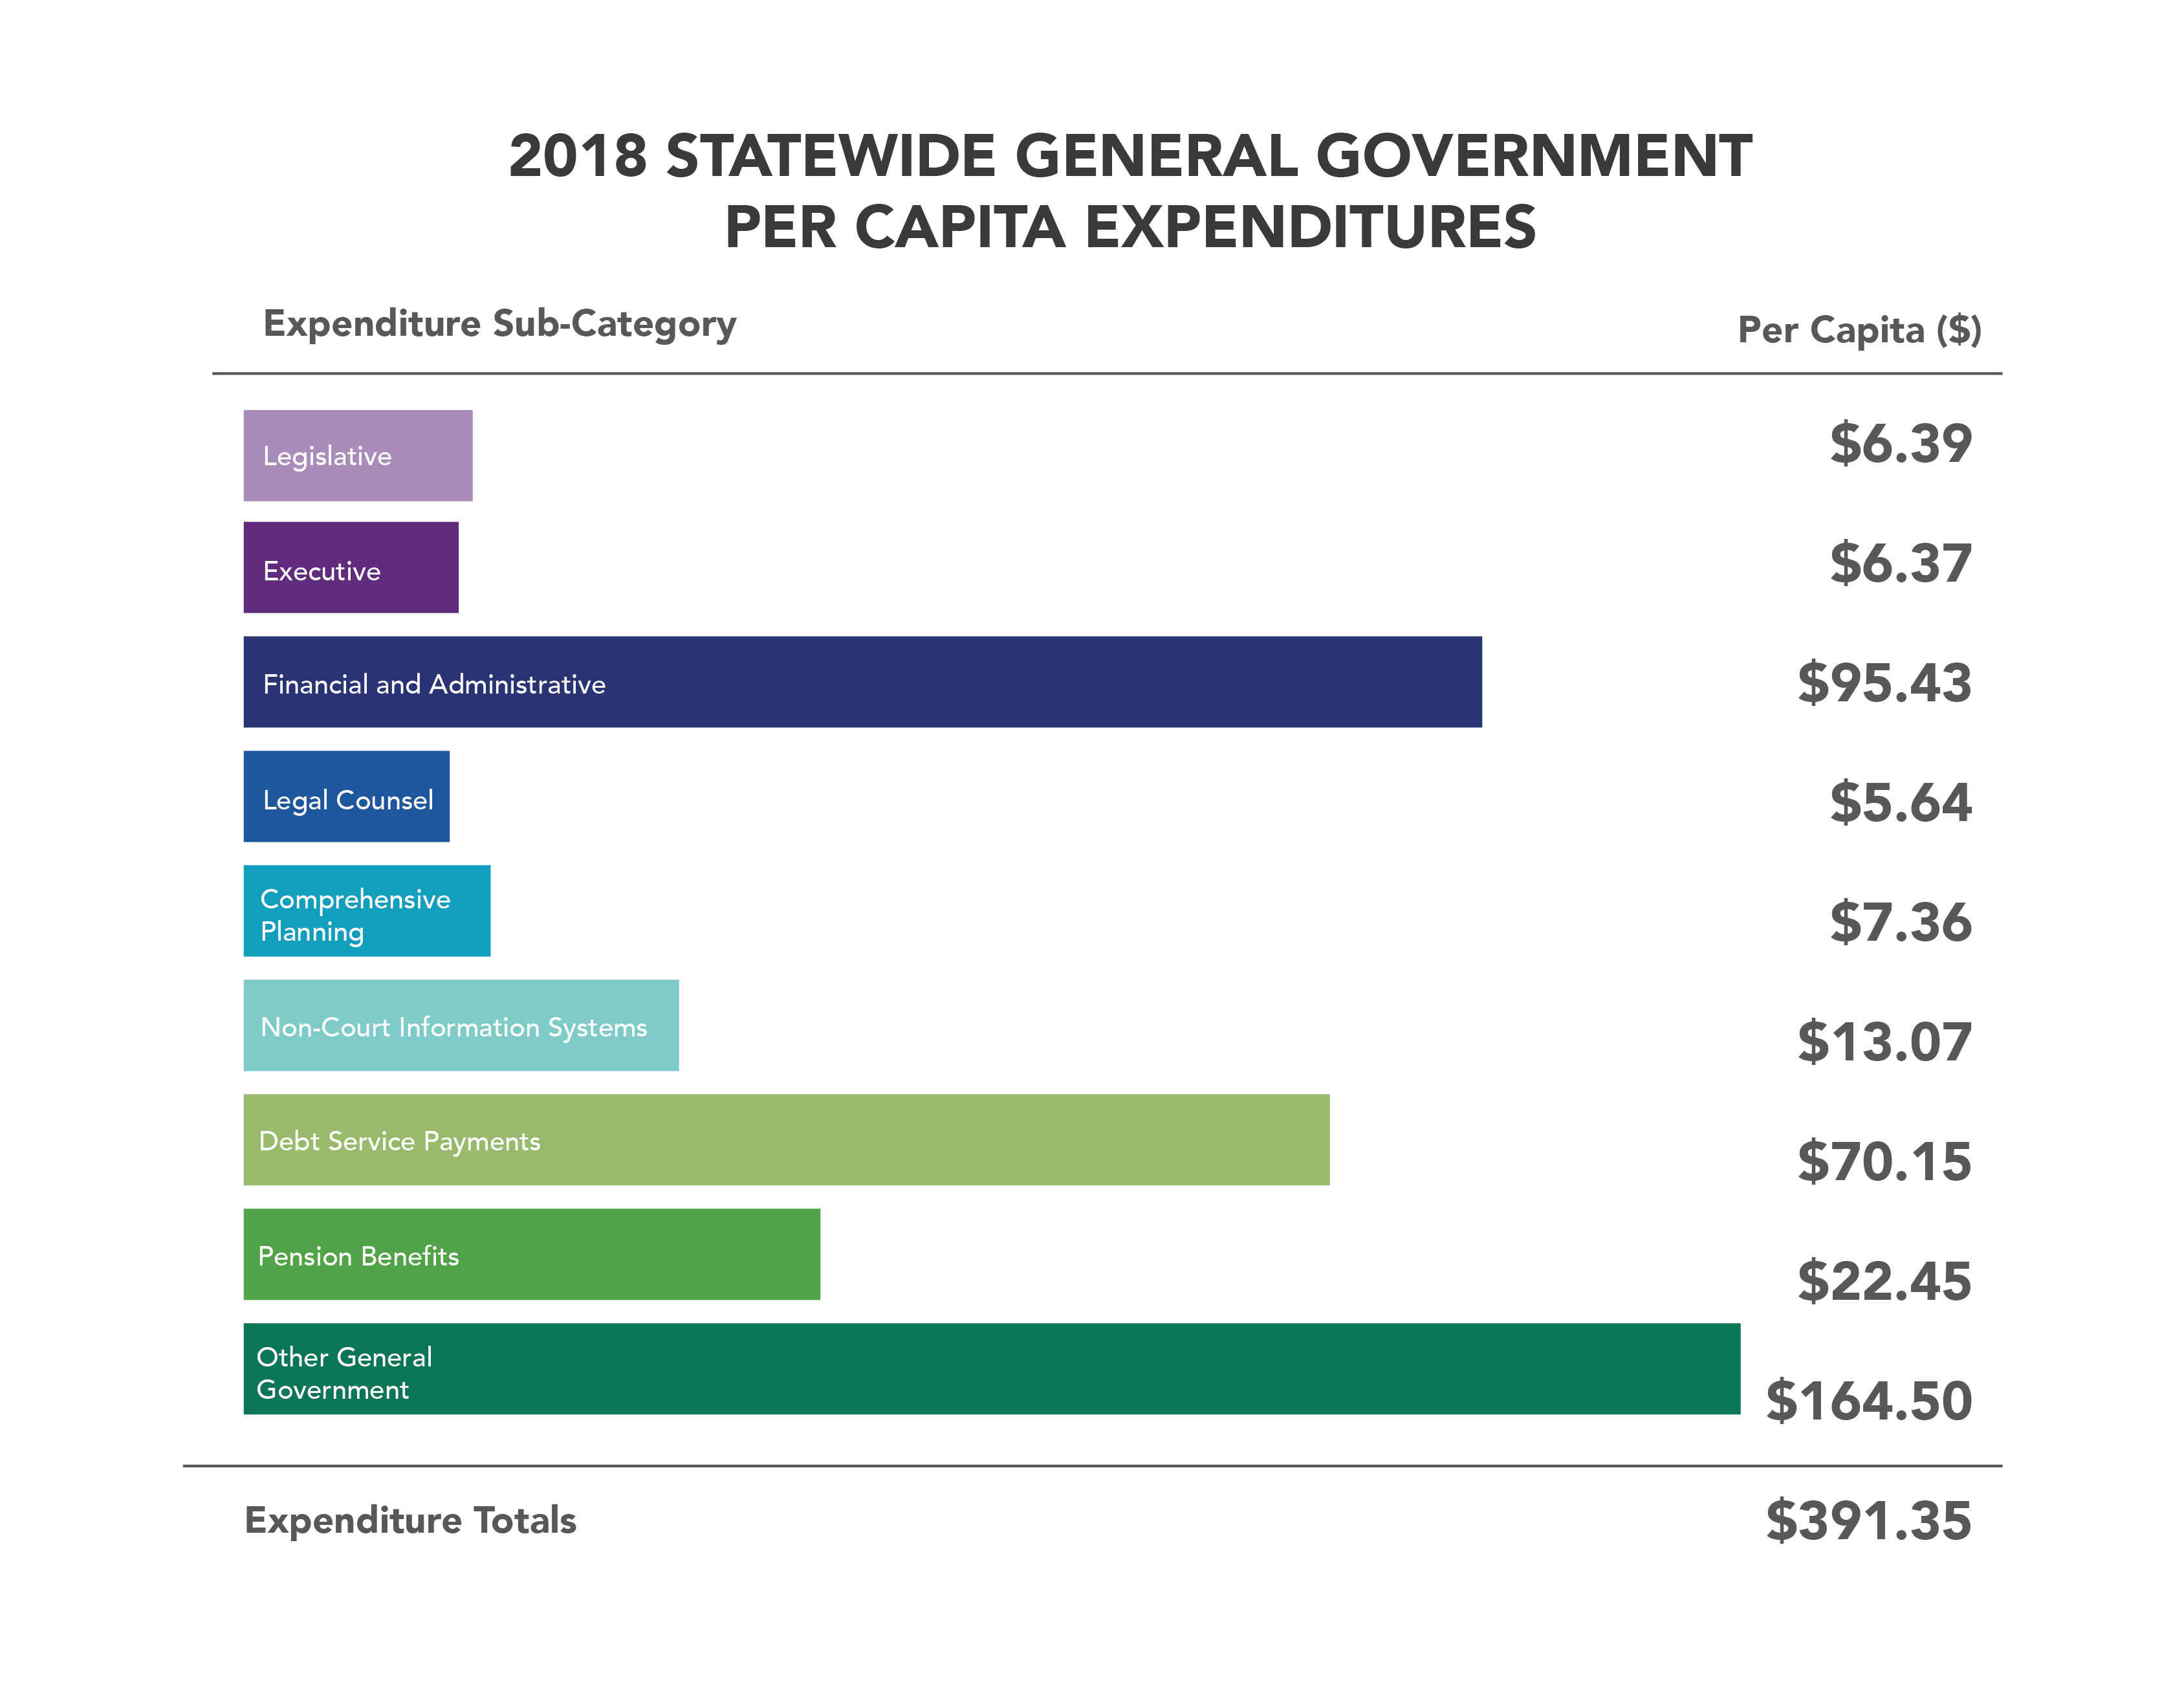
Over two-fifths of all General Government expenditures (42.03%) were spent on Other General Government services. This classification accounts for costs that do not fall narrowly within the other expenditure categories i.e. facility maintenance. The total per capita spending for Other General Government expenditures was $164.50.
Financial and Administration expenditures accounted for the second highest expenditure category at 24.38%, while Debt Service Payments expenditures followed at 17.92% of statewide General Government expenditures.
The total per capita spending for Financial and Administration expenditures was $95.43 and $70.15 for Debt Service Payments. Financial and Administration expenditures account for costs associated with the provision of services related to budgeting, accounting, auditing, property appraisal, tax collecting, personnel, purchasing, communication, pension administration, printing, stores, property control and grants development. Debt Service Payments account for costs associated with principal & interest expenses related to outstanding bonds.
While Pension Benefits statewide spending was the fourth highest expenditure category with a 5.74% share of total statewide expenditures and total per capita spending was $22.45, it must be noted that only 6 counties experienced any expenditure in this category. Of those 6 counties, Duval/City of Jacksonville accounted for 90.55% of the total Pension Benefits expenditures statewide, or 5.19% of the entire General Government Expenditures statewide.
Non-Court Information Systems expenditures accounted for the fifth highest expenditure category at 3.34% share of total statewide expenditures and total per capita spending was $13.07.
The expenditure categories of Legislative, Executive, Legal Counsel, and Comprehensive Planning spending collectively accounted for 6.58% of the total General Government expenditures. The total per capita spending for Legislative, Executive, Legal Counsel, and Comprehensive Planning was $6.39, $6.37, $5.64, and $7.36 respectively.
