
2021 County Revenues & Expenditures: Taxes
County governments have the responsibility to provide not only core public services, but also to provide the infrastructure and services that form the foundation of local and state economies. Adequate revenue must be raised to fund these local needs, while also providing for services and programs that are mandated by the state. If counties are to succeed in meeting their responsibilities, an adequate and fair local tax policy that is commensurate with the many responsibilities of modern county government must be maintained.
In FY 2018, tax revenues accounted for $15,738,092,785 or 31.86% of all statewide revenues for Florida’s counties, the second largest revenue category. The statewide average percentage share was equal to 35.66%, when comparing tax revenues to all revenues on a county-by-county basis. The total per capita receipts for tax revenues was equal to $755.17 per person statewide. This represents an increase of $1,096,894,53, or 7.49% from the previous f iscal year. The total per capita receipts for tax revenues increased by $40.41, or 5.65% from the previous fiscal year.
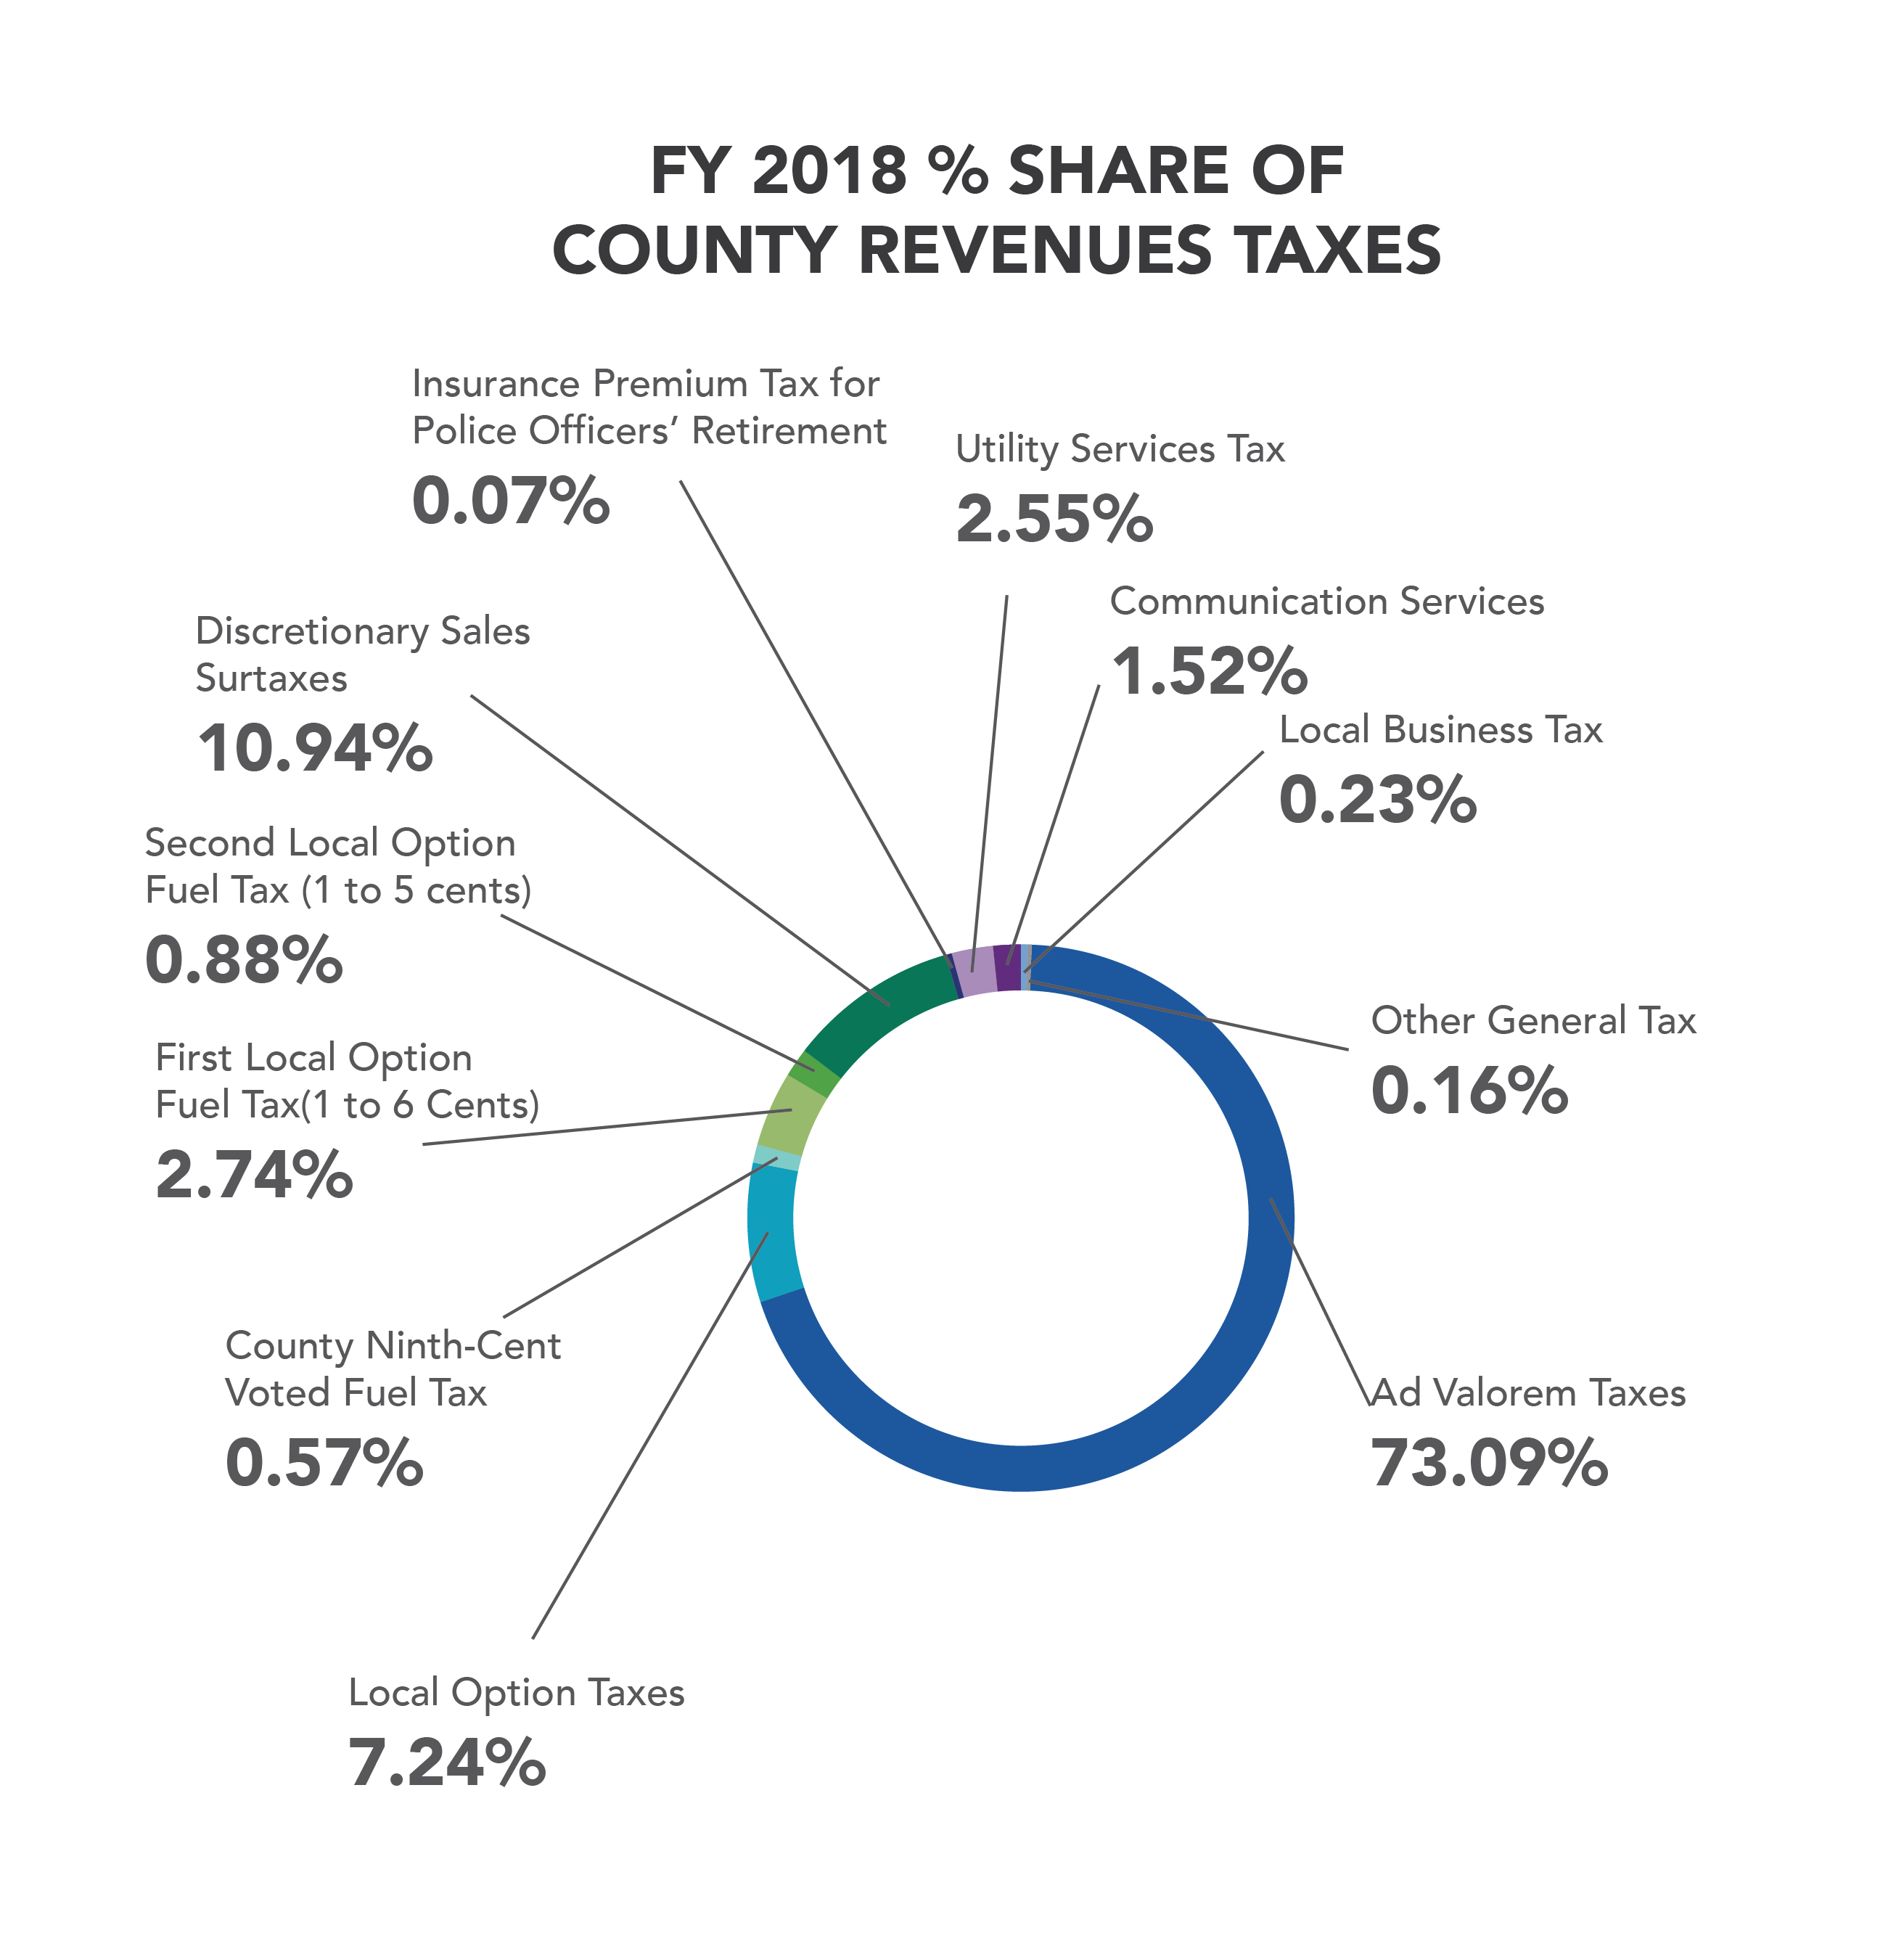
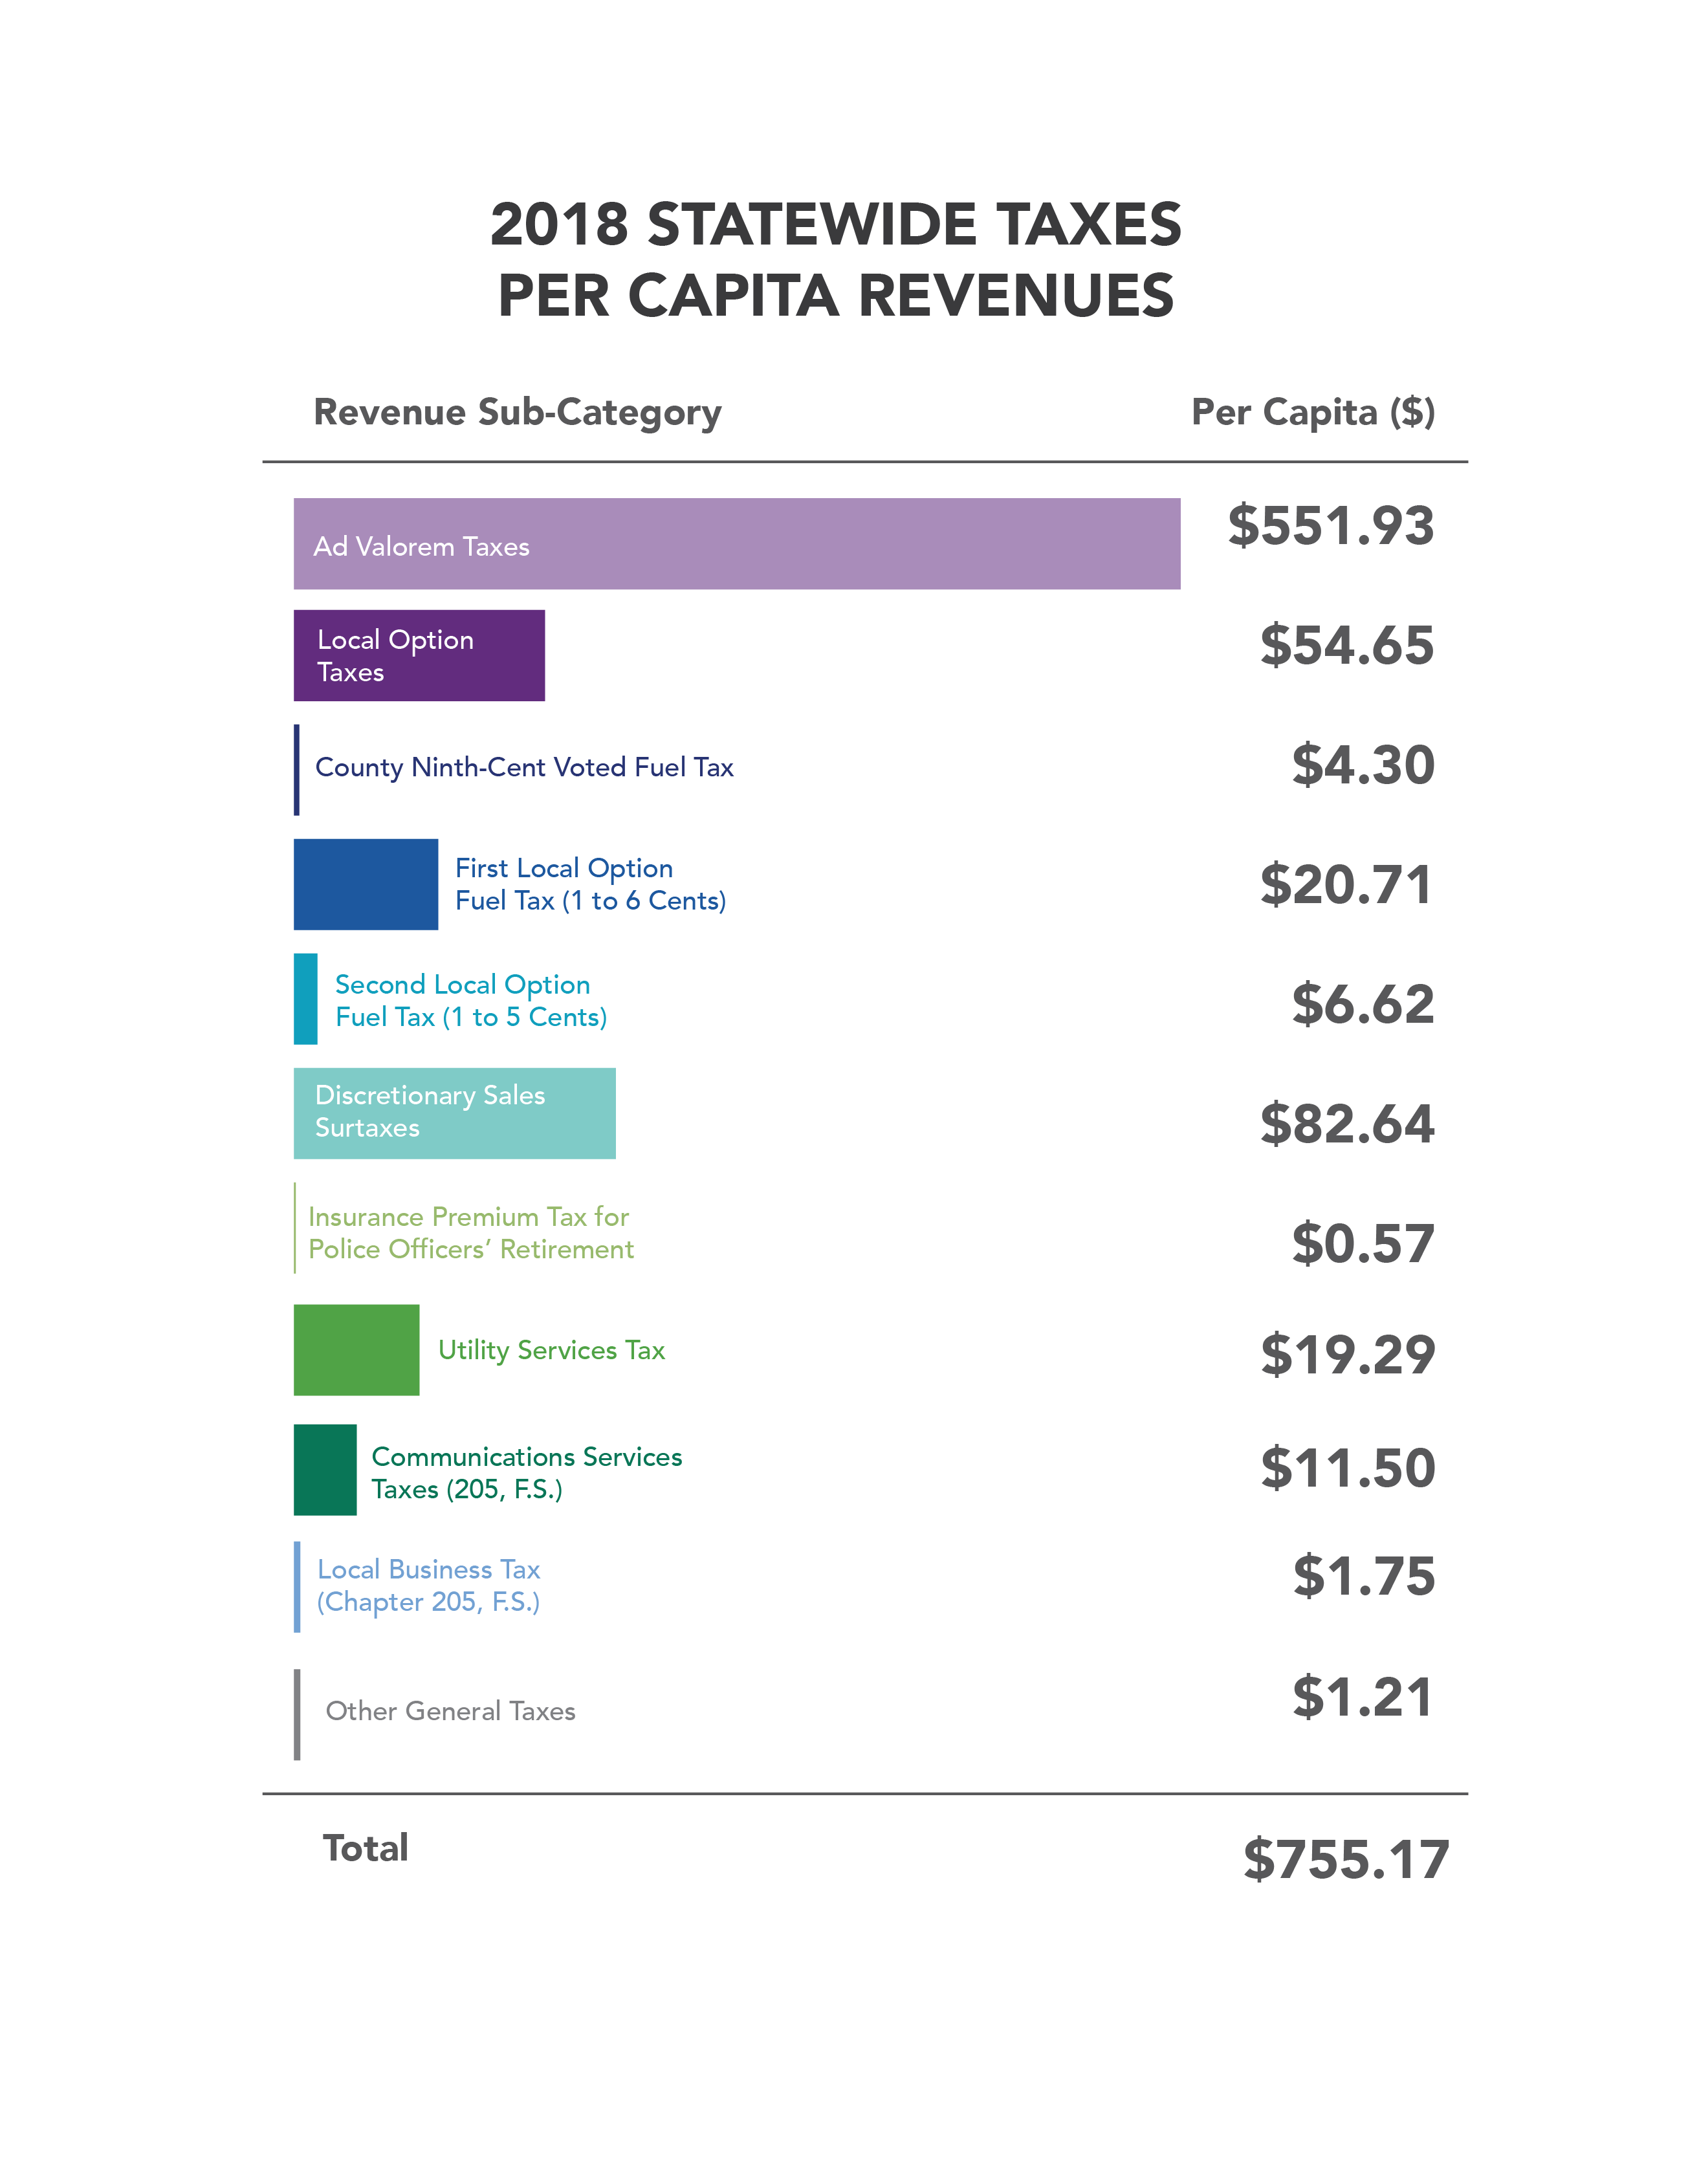
The overwhelming majority of tax revenue was classified as Ad Valorem, or property taxes. This category accounted for 73.09% of total tax revenue, $551.93 in per capita receipts for FY 2018.
Discretionary Sales Surtaxes revenue accounted for the second highest revenue category at 10.94%, while Local Option Taxes follow at 7.24% of statewide tax revenues. The total per capita receipts for Discretionary Sales Surtax revenues was $82.64 and $54.65 for Local Option Tax revenues. Discretionary Sales Surtaxes include Charter County Transportation, Local Government Infrastructure, Small Counties, Indigent Care & Trauma Centers, County Public Hospital, School Capital Outlay, and Voter-Approved Indigent Care. Local option taxes include taxes for tourism development, convention development, sport franchise facilities, food & beverage, and tourism impact.
Local Option Fuel Taxes are levied for the purpose of paying the cost of establishing, operating, and maintaining transportation systems and related facilities as well as expenditures relating to streets and roads. The combined Local Option Fuel Taxes are the categories of First (1 to 6 cents), Second (1 to 5 cents), and County Ninth-Cent Voted Fuel Taxes. The combined Local Option Fuel Taxes accounted for 4.19% of statewide Tax revenue, $31.63 in per capita revenues for FY 2018.
Utility Services Tax revenue accounted for the fifth highest revenue category at 2.55%, while Communications Services Taxes followed at 1.52% of statewide tax revenues. The total per capita receipts for Utility Services Tax revenues was $19.29 and $11.50 for Communications Services Tax revenues for FY 2018.
Utility Services Taxes allow charter counties to tax for the purchase of electricity, metered natural gas, liquified petroleum gas, manufactured gas, and water services. Communications Services Taxes are imposed on retail sales of communication services that originate and terminate within the state, encompassing voice, data, audio, video, or any other information or signals. The revenue categories of Local Business Taxes, Insurance Premium Tax for Police Officers’ Retirement, and all other General Taxes receipts collectively accounted for 0.47% of the total tax revenues. The total per capita receipts for Local Business Taxes, Insurance Premium Tax for Police Officers’ Retirement, and all other General Taxes was $1.75, $0.57, and $1.21 respectively.