Florida’s transportation system is a vital component in building and sustaining communities, moving people and goods, and developing competition at local and regional levels, as well as on the national scale. Florida’s counties play a critical role in the state’s transportation system. Florida’s counties are major partners in the maintenance and development of Florida’s transportation infrastructure.
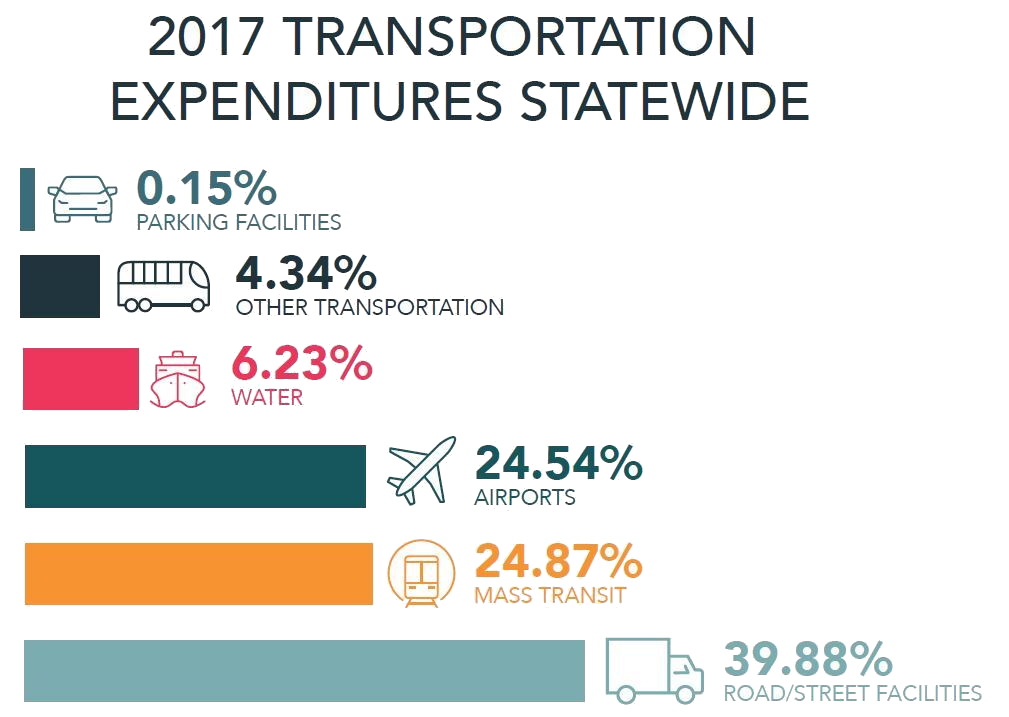
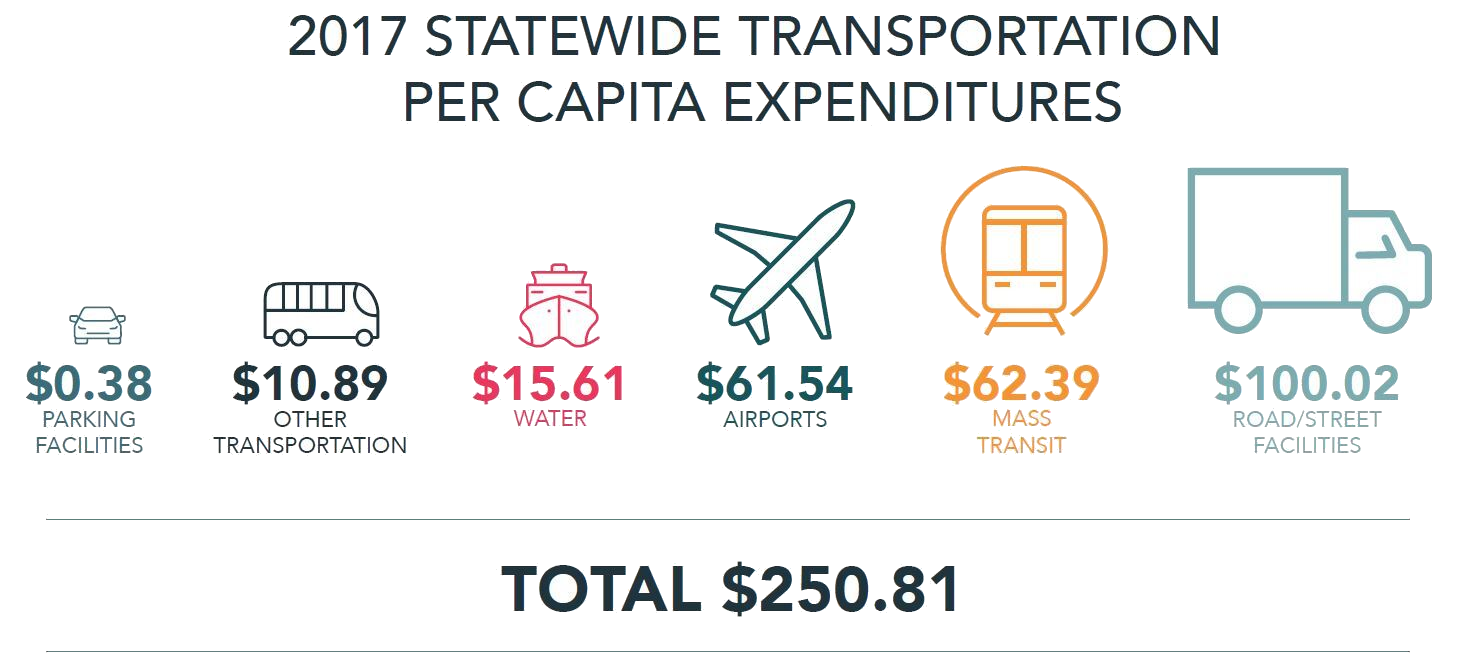
In FY 2017, Transportation expenditures accounted for 11.62% of all statewide expenditures for Florida’s counties, the fifth largest expenditure category. The statewide average percentage share is equal to 13.71%, when comparing Transportation to all expenditures on a county-by-county basis. The total per capita spending for Transportation expenditures was equal to $250.81 per person statewide.
The majority of Transportation spending is concentrated within three expenditure categories statewide: Road/Street Facilities, Airports, and Mass Transit. These three categories account for about 89% of total Transportation spending, $223.95 in per capita expenditures for 2017.
Almost two-fifths of all Transportation expenditures (39.88%) are spent on Road/Street Facilities. The total per capita spending for Road/Street Facilities expenditures was $100.02. Road/Street Facilities expenditures accounts for costs associated with maintenance to roadways and rights-of-way.


There are over 100 activities associated with transportation maintenance from pothole repair, street cleaning, or dead animal pick up. Preventative maintenance allows local government to plan and develop the community it serves. Additionally, this funding provides for road and traffic engineers to create safer roadways.
Mass Transit expenditures account for the second highest expenditure category at 24.87% of statewide Transportation expenditures. The total per capita spending for Mass Transit expenditures was $62.39.
Mass Transit expenditures account for the second highest expenditure category at 24.87% of statewide Transportation expenditures. The total per capita spending for Mass Transit expenditures was $62.39.
Airports expenditures account for the third highest expenditure category at 24.54% of statewide Transportation expenditures. The total per capita spending for Airports expenditures was $61.54. It should be noted for both categories, half of all counties do not report any expenditures.
The expenditure categories of Water (transportation), Parking Facilities, and Other Transportation spending collectively account for 10.72% of the total Transportation expenditures. The total per capita spending for Water (transportation), Parking Facilities, and Other Transportation was $15.61, $0.38, and $10.89 respectively.
The expenditure categories of Water (transportation), Parking Facilities, and Other Transportation spending collectively account for 10.72% of the total Transportation expenditures. The total per capita spending for Water (transportation), Parking Facilities, and Other Transportation was $15.61, $0.38, and $10.89 respectively.
