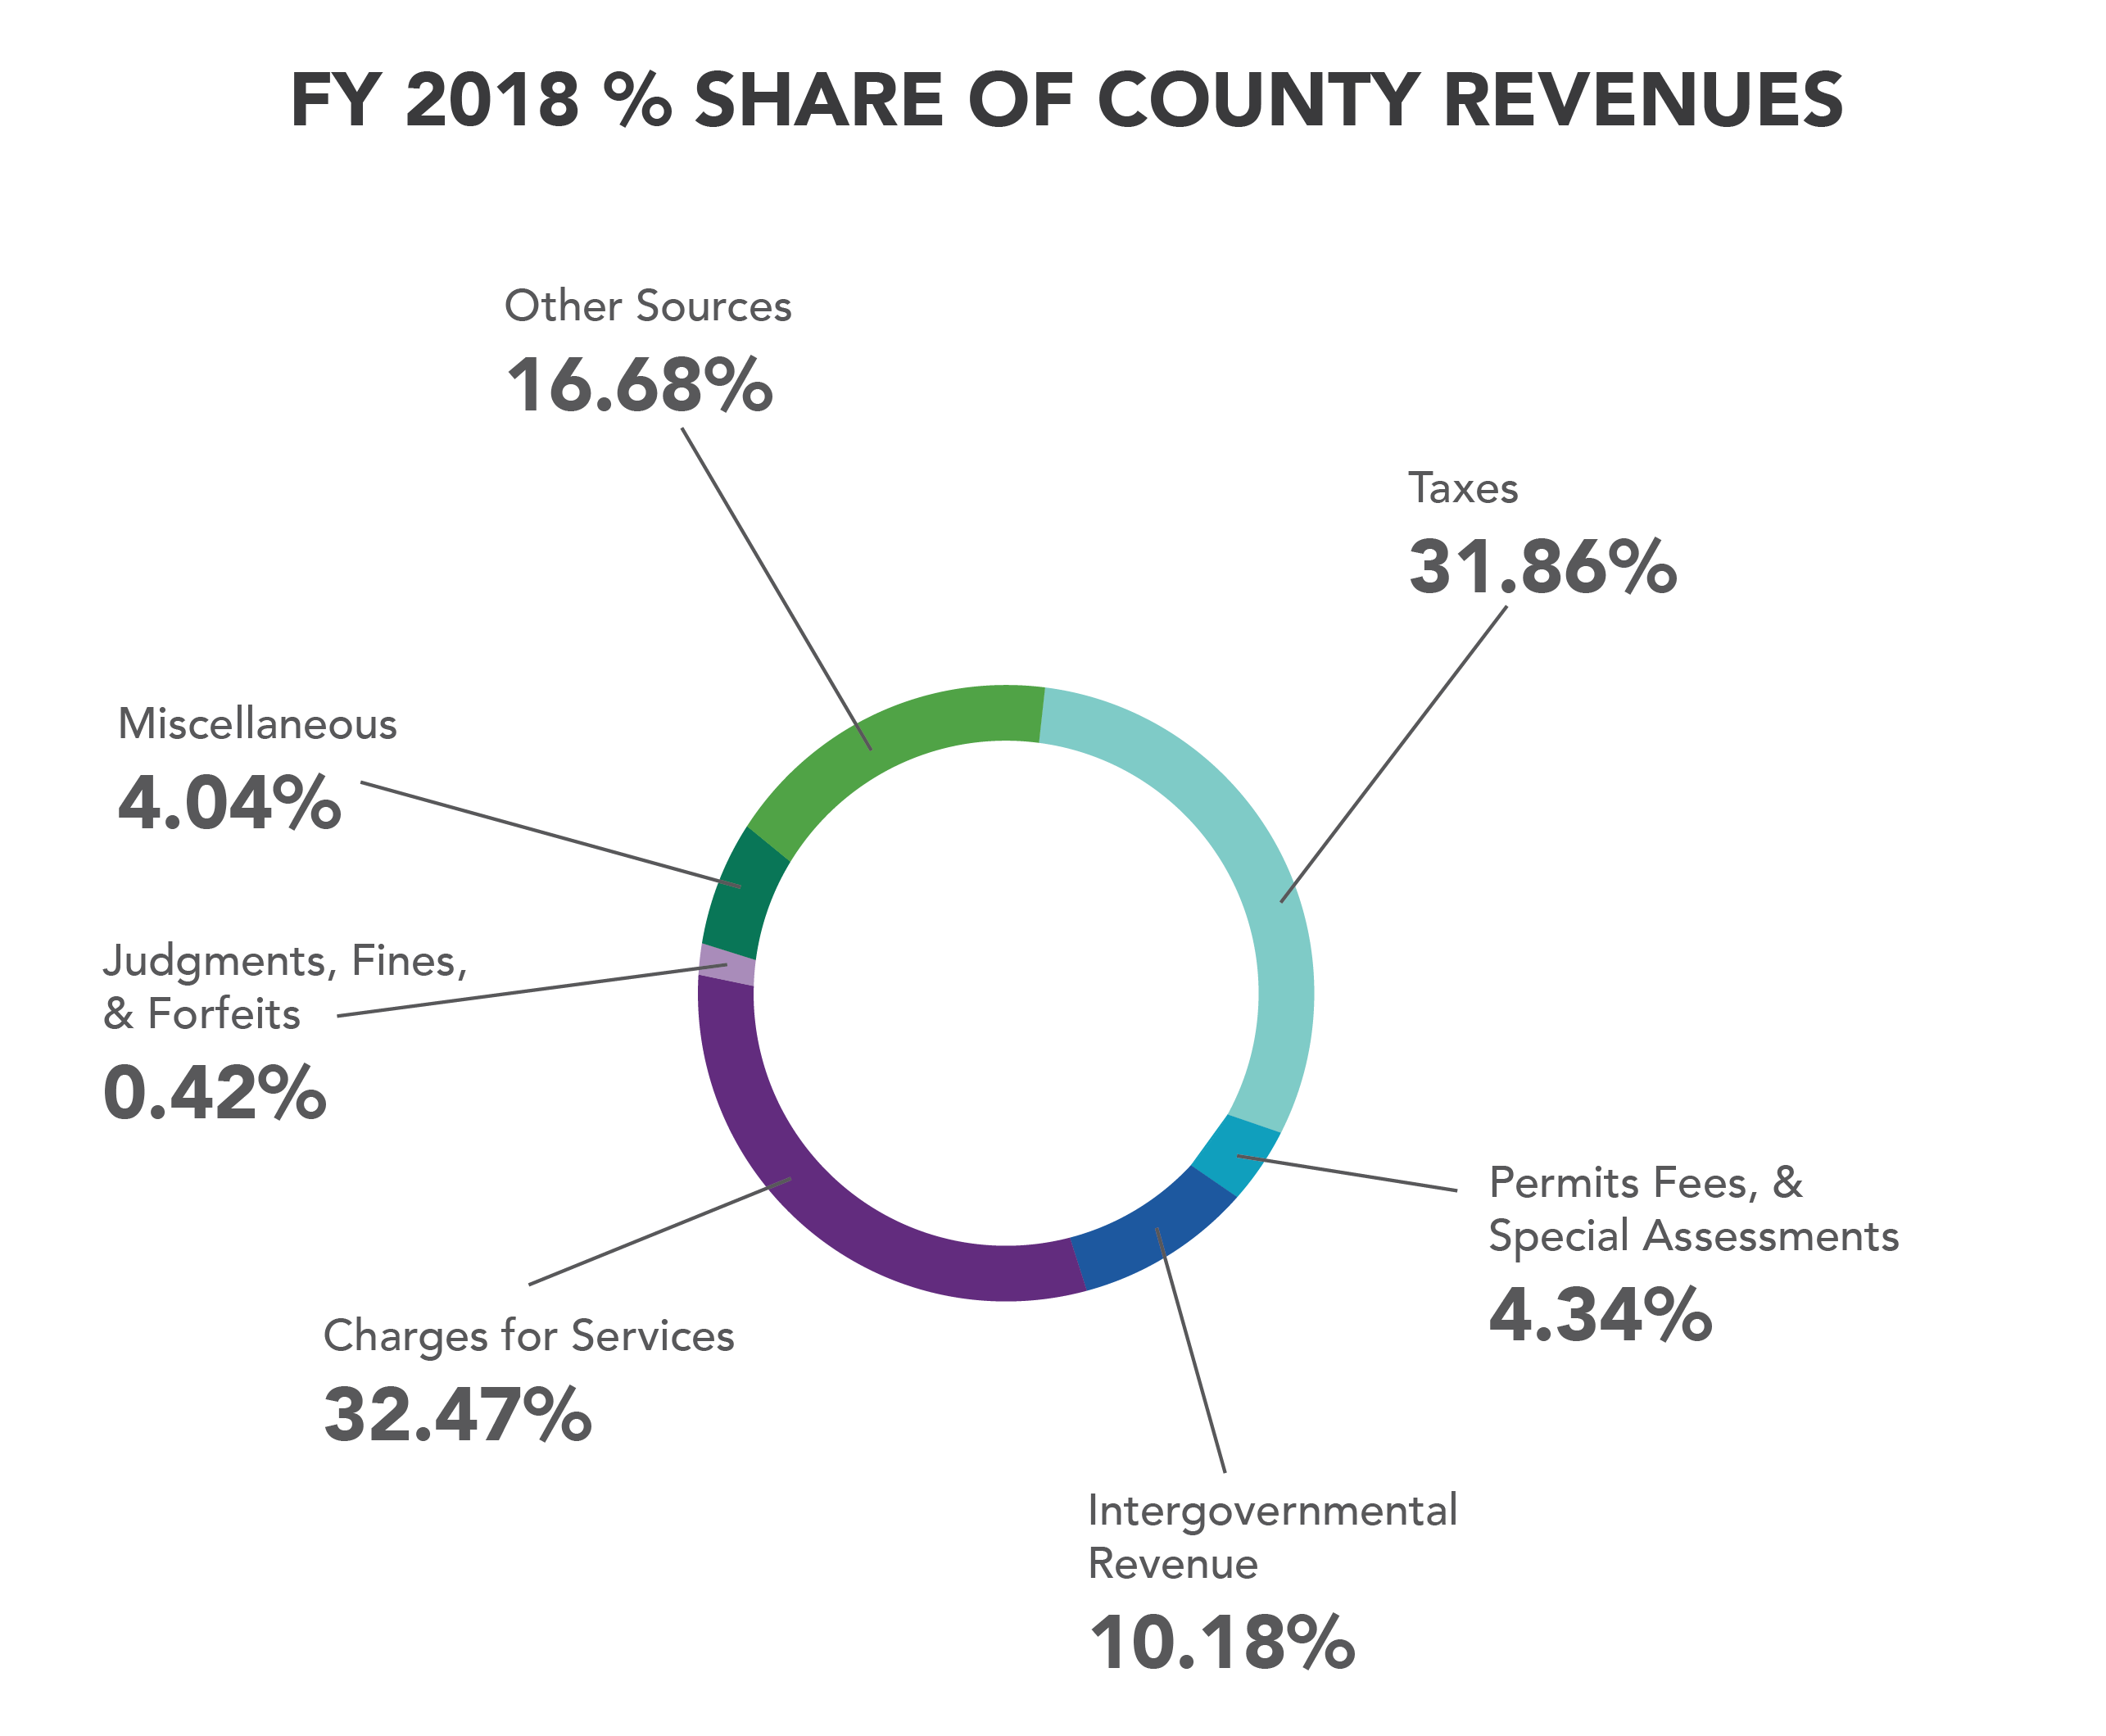
The majority of county receipts was concentrated within four revenue categories: Charges for Services, Taxes, Other Sources, and Intergovernmental Revenue. These four revenue categories account for about 91% of total statewide county revenue, $2,161.32 in per capita revenues for FY 2018.
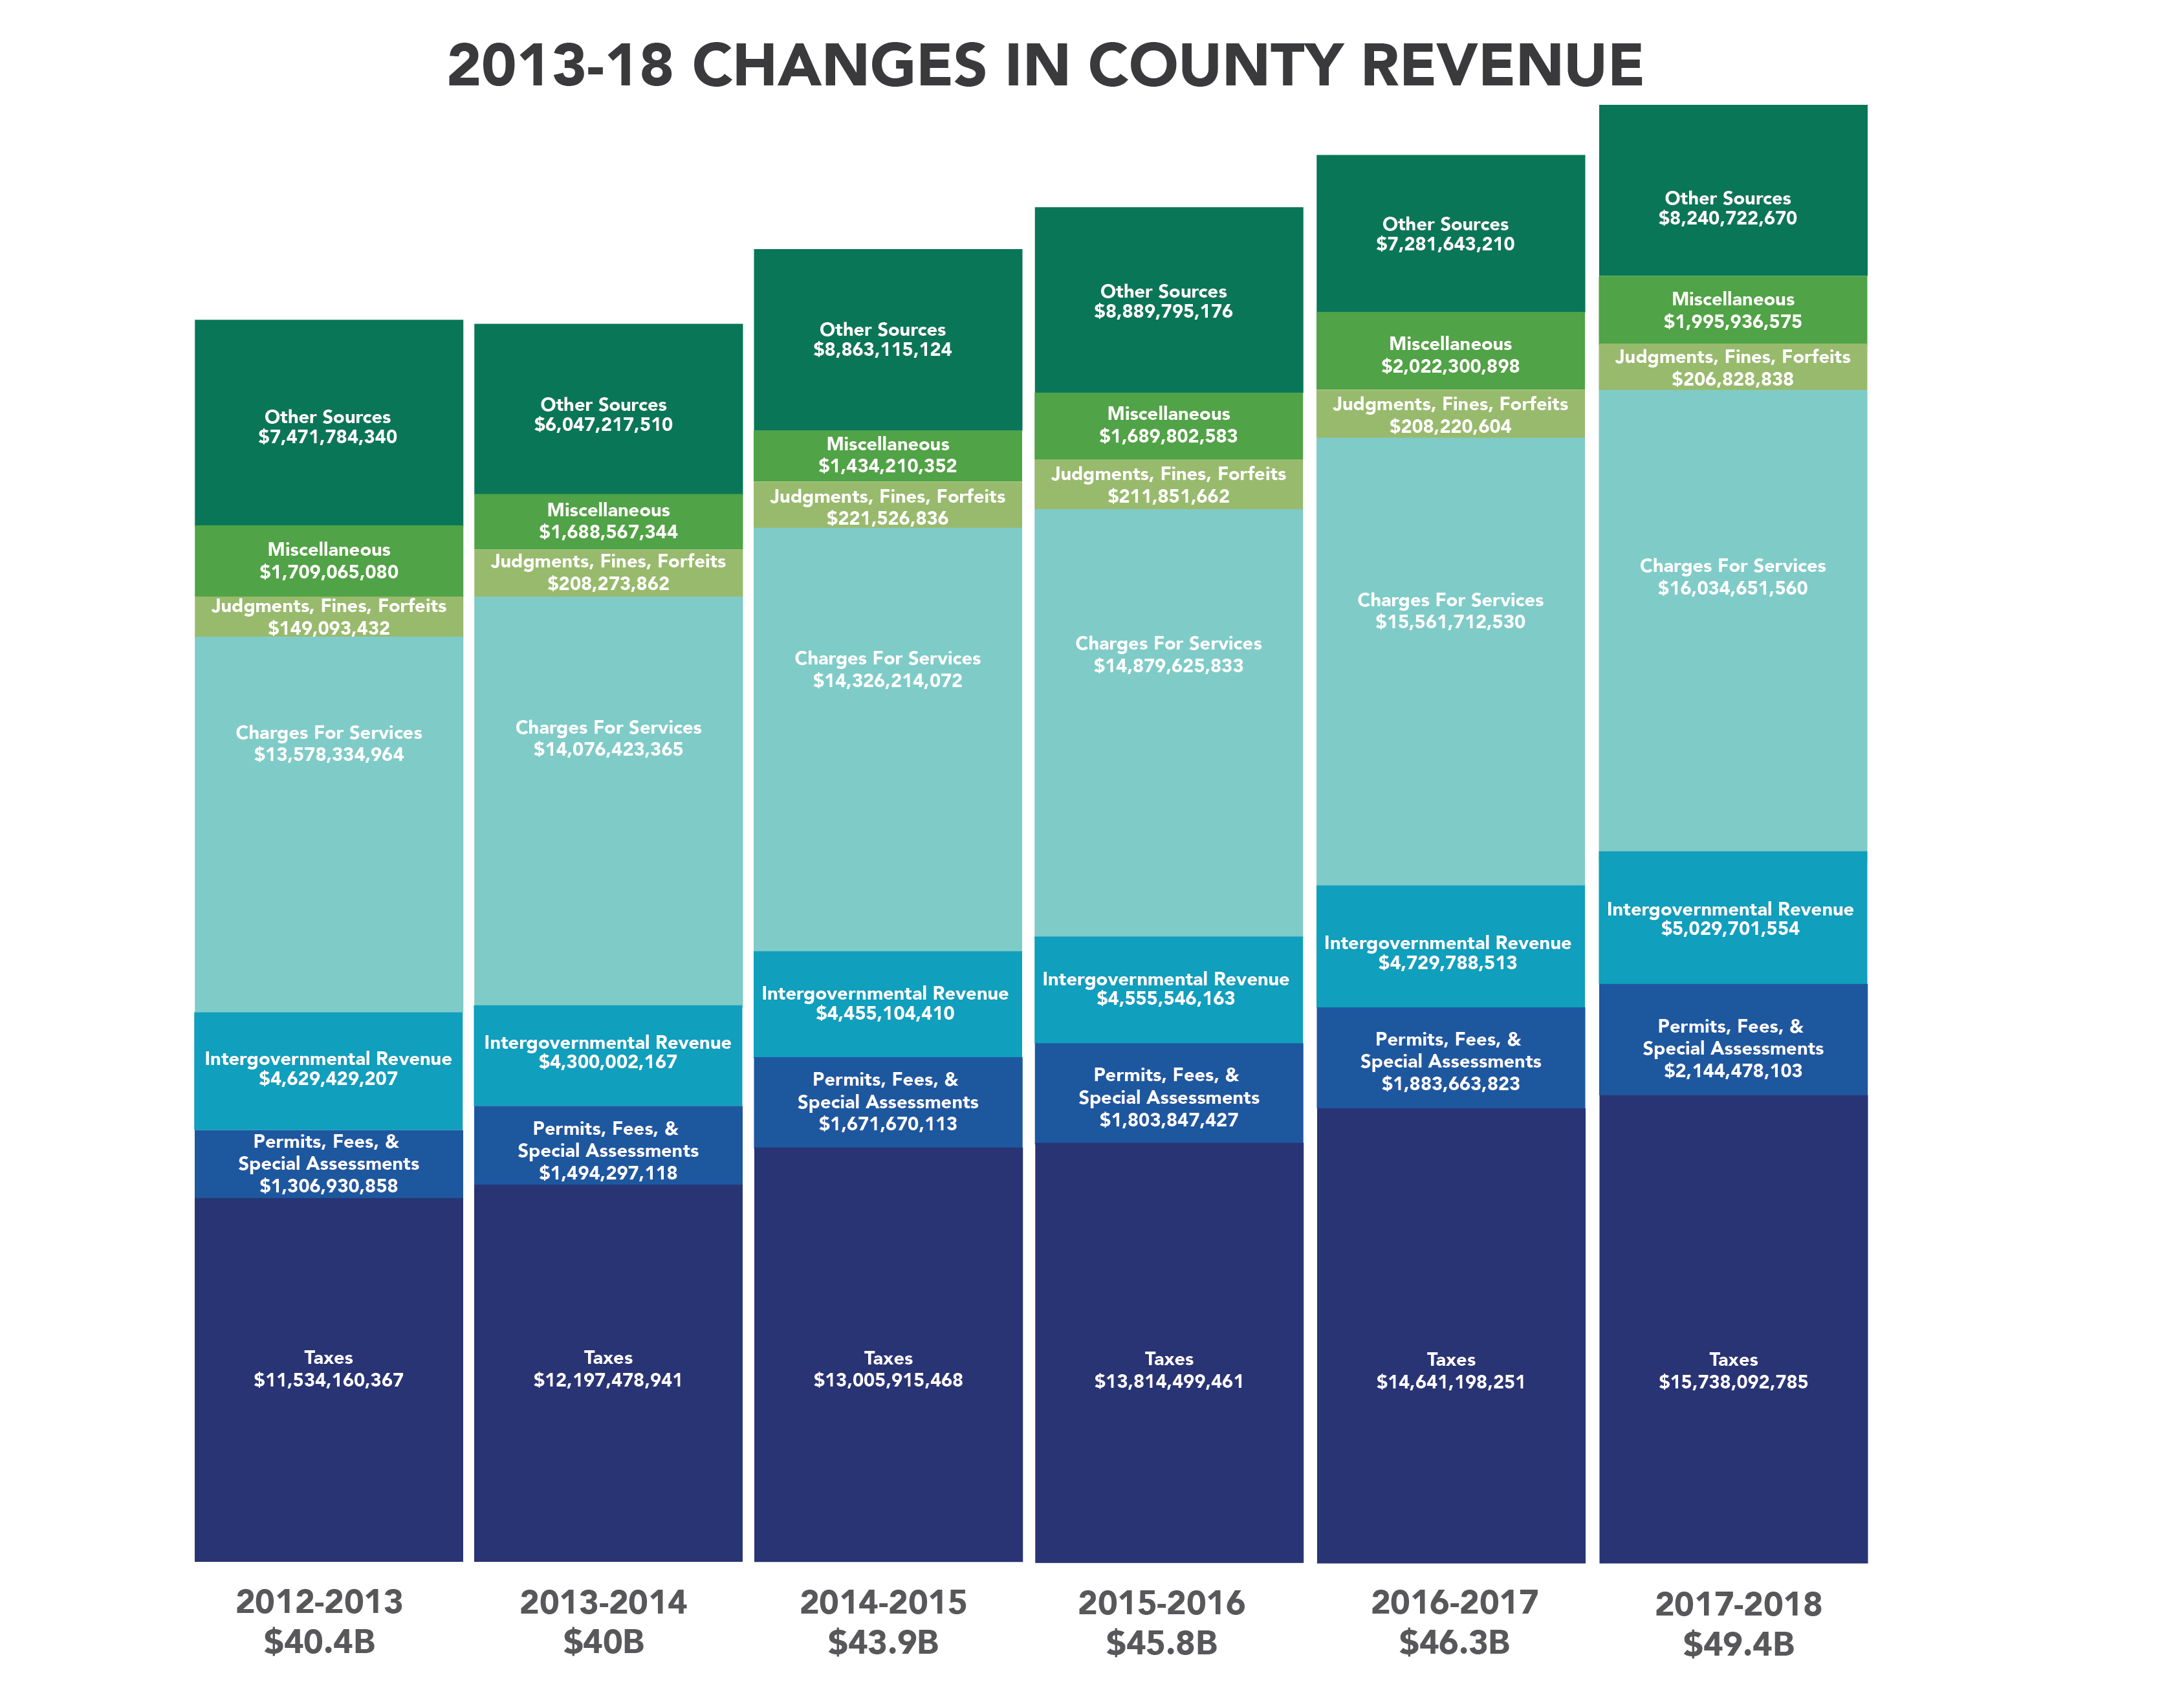
Over the last six years, FY 2013 to FY 2018, the proportion of the total revenues for each revenue subcategory remained relatively static. The most significant trend was an overall increase in percentage share of taxes over the six-year time period by roughly 3% of total revenues statewide. Additionally, the total amount of revenue increased by approximately $9.0 billion from $40.4 billion in FY 2013 to the $49.4 billion in FY 2018.
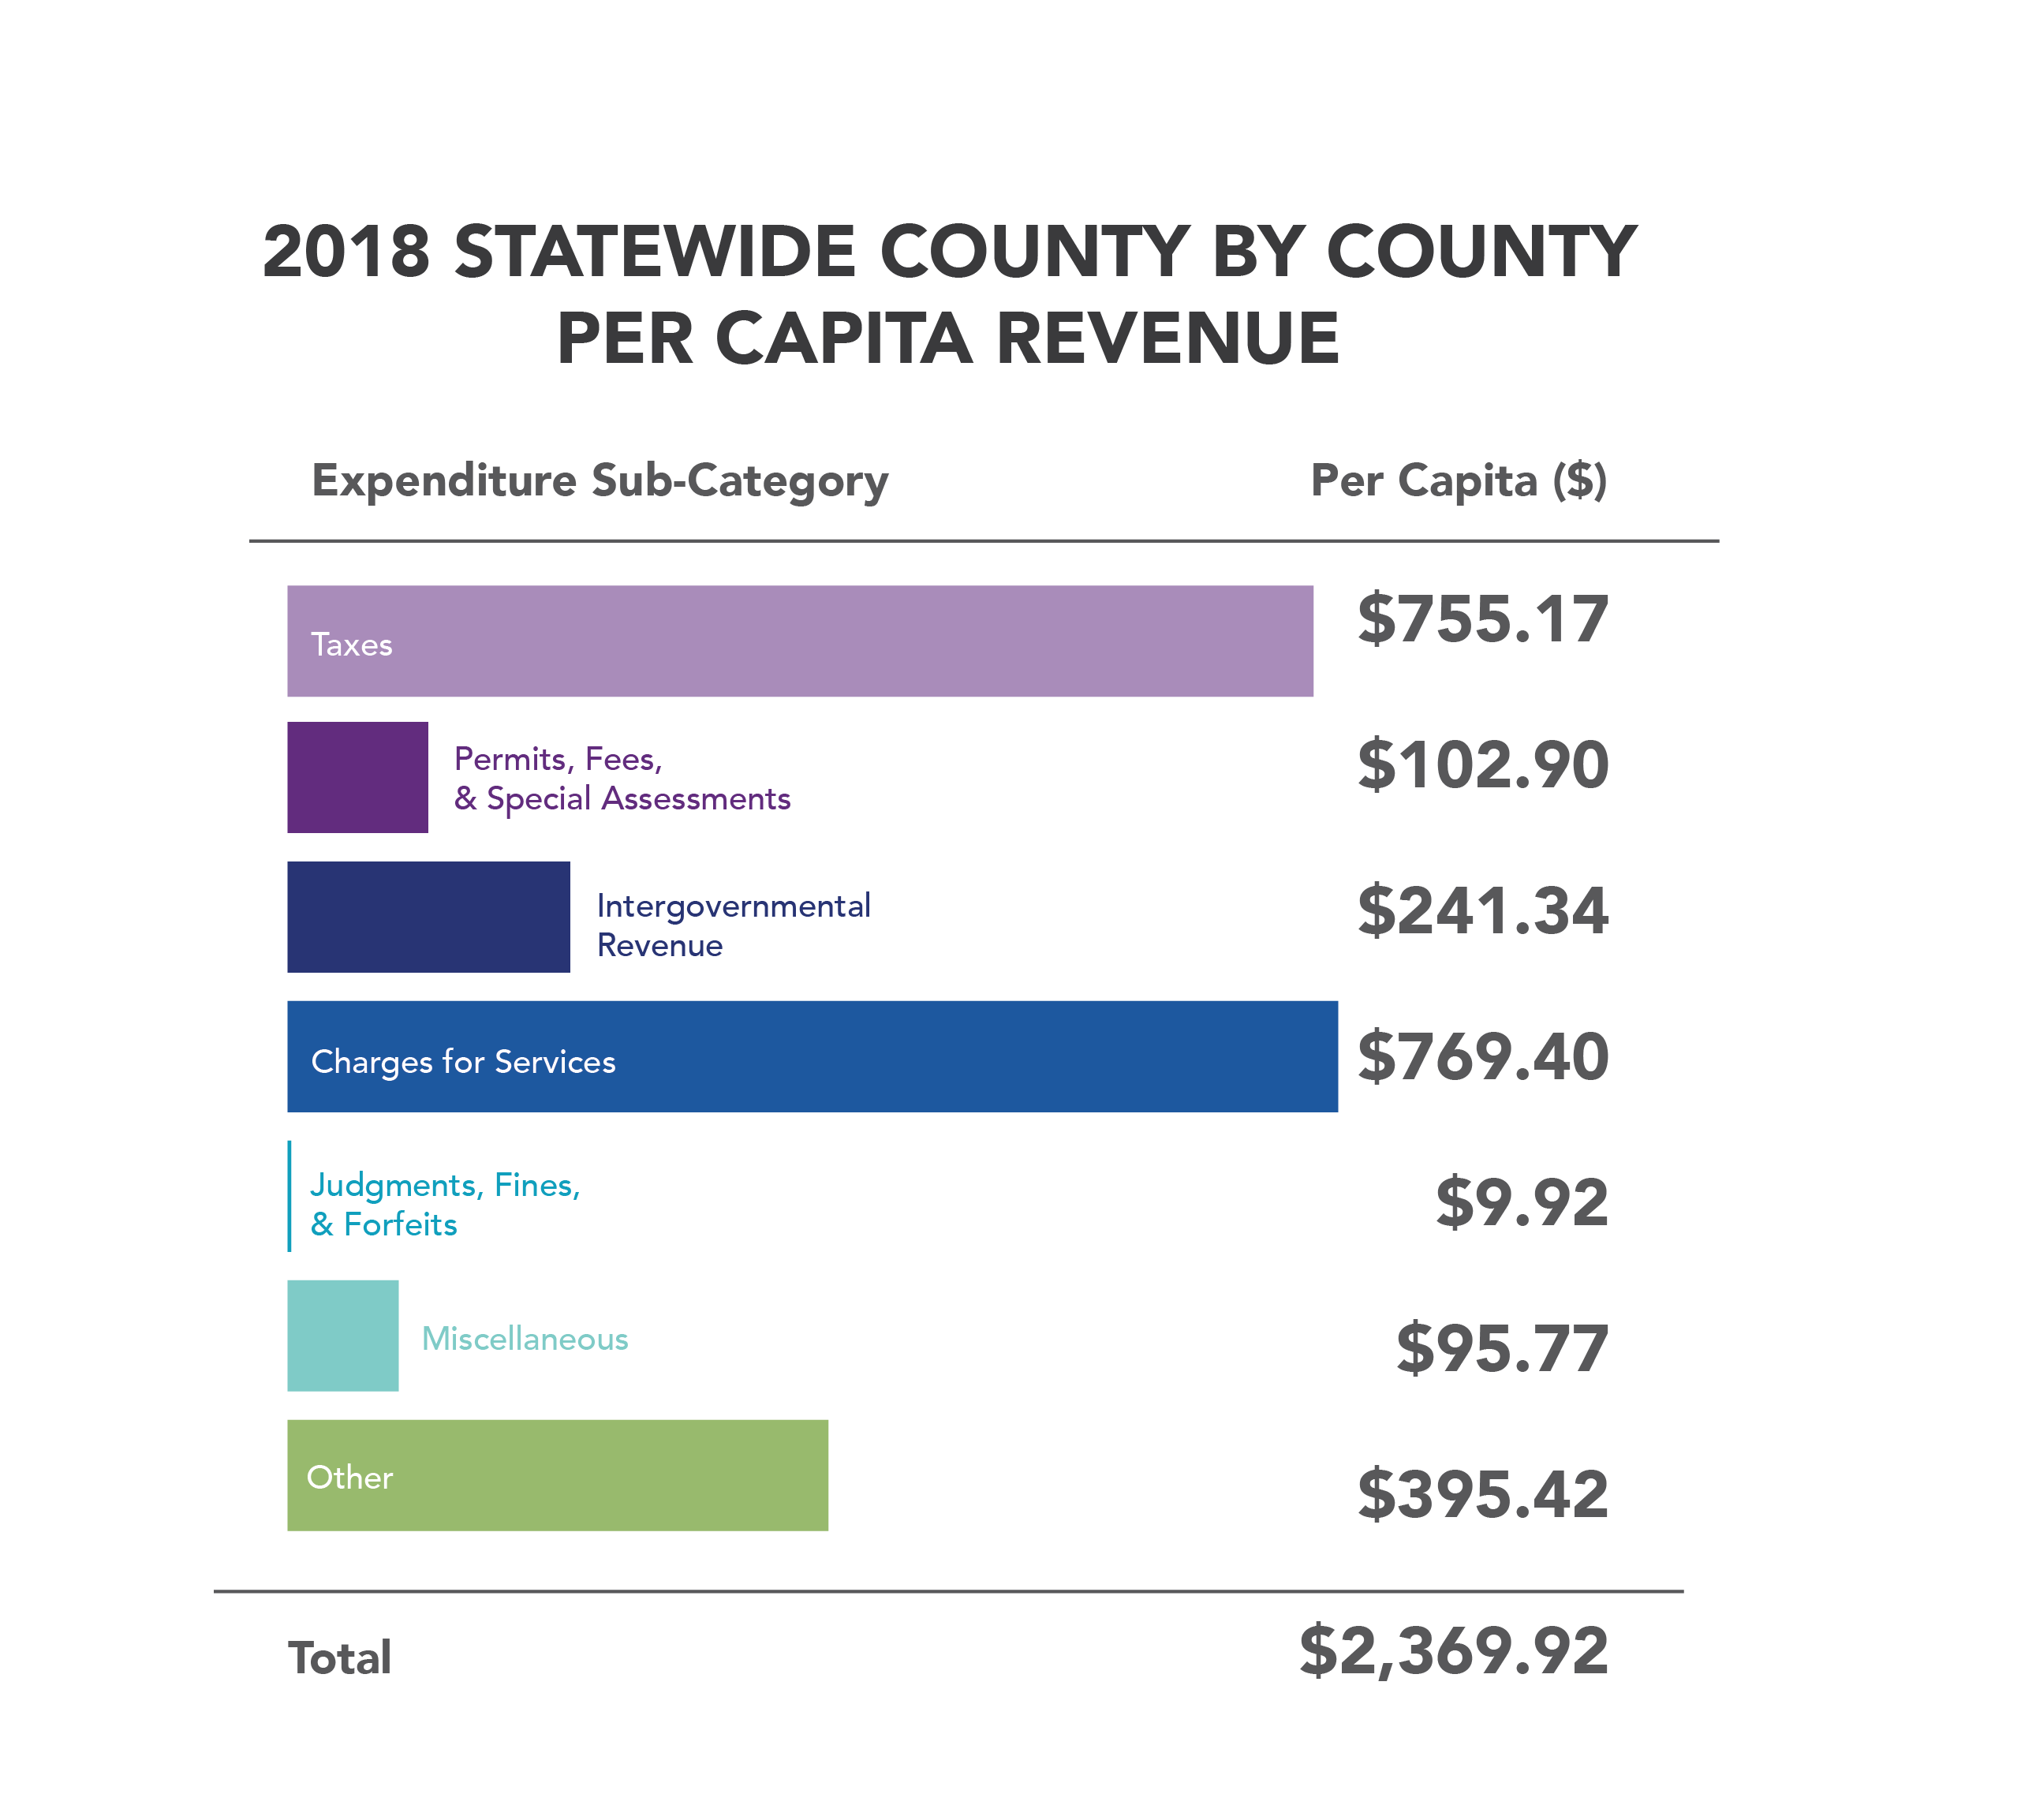
Charges for Services represented the largest category of receipts for local governments accounting for 32.47% of total statewide revenues. The total per capita revenue for Charges for Services equaled $769.40 per person statewide. On a year-by-year basis, the total per capita receipts statewide for Charges for Services revenues increased by $9.70, an increase of 1.28%. Taxes were the second largest revenue accounting for 31.86% of total statewide revenues. The total per capita revenue for Taxes equaled $755.17 per person statewide. On a year-by-year basis, the total per capita receipts statewide for Taxes revenues increased by $40.41, an increase of 5.65%.
Other Sources of revenue was the third largest revenue category accounitng for 16.66% of total statewide revenue. The total per capita revenue for Other Sources of revenue equaled $395.42 per person statewide. On a year-by-year basis, the total per capita receipts statewide for Other Sources of revenue increased by $39.94, an increase of 11.24%.
Intergovernmental Revenue represented the fourth largest category of receipts for local governments accounting for 10.18% of total statewide revenues. The total per capita revenue for Intergovernmental Revenue equaled $241.34 per person statewide. On a year-by-year basis, the total per capita receipts statewide for Intergovernmental Revenue increased by $10.44, an increase of 4.52%. Permits, Fees, & Special Assessments Revenue was the third smallest revenue category for FY 2018 accounting for 4.34% of total statewide revenues. The total per capita revenue for Permits, Fees, & Special Assessments equaled $102.90 per person statewide. On a year-by-year basis, the total per capita receipts statewide for Permits, Fees, & Special Assessments Revenue increased by $10.94, an increase of 11.90%. Miscellaneous revenue was the second smallest revenue category for FY 2018 accounting for 4.04% of total statewide revenues. The total per capita receipts for Miscellaneous revenue equaled $95.77 per person statewide. On a year-by-year basis, the total per capita receipts statewide for Miscelleanous Revenue decreased by $2.95, a decrease of 2.99%.
The smallest revenue category for FY 2018 was Judgments, Fines, & Forfeits, which accounted for 0.42% of total statewide county revenues. Judgments, Fines, & Forfeits represented the smallest contribution of statewide revenues with total per capita receipts equaling $9.92 per person. On a year-by-year basis, the total per capita receipts statewide for Judgments, Fines, & Fees revenue decreased by $0.24, a decrease of 2.37%.