Charges for Services are a reflection of all revenues stemming from services being provided by a local government. This includes all charges collected whether from private individuals or other governmental units.
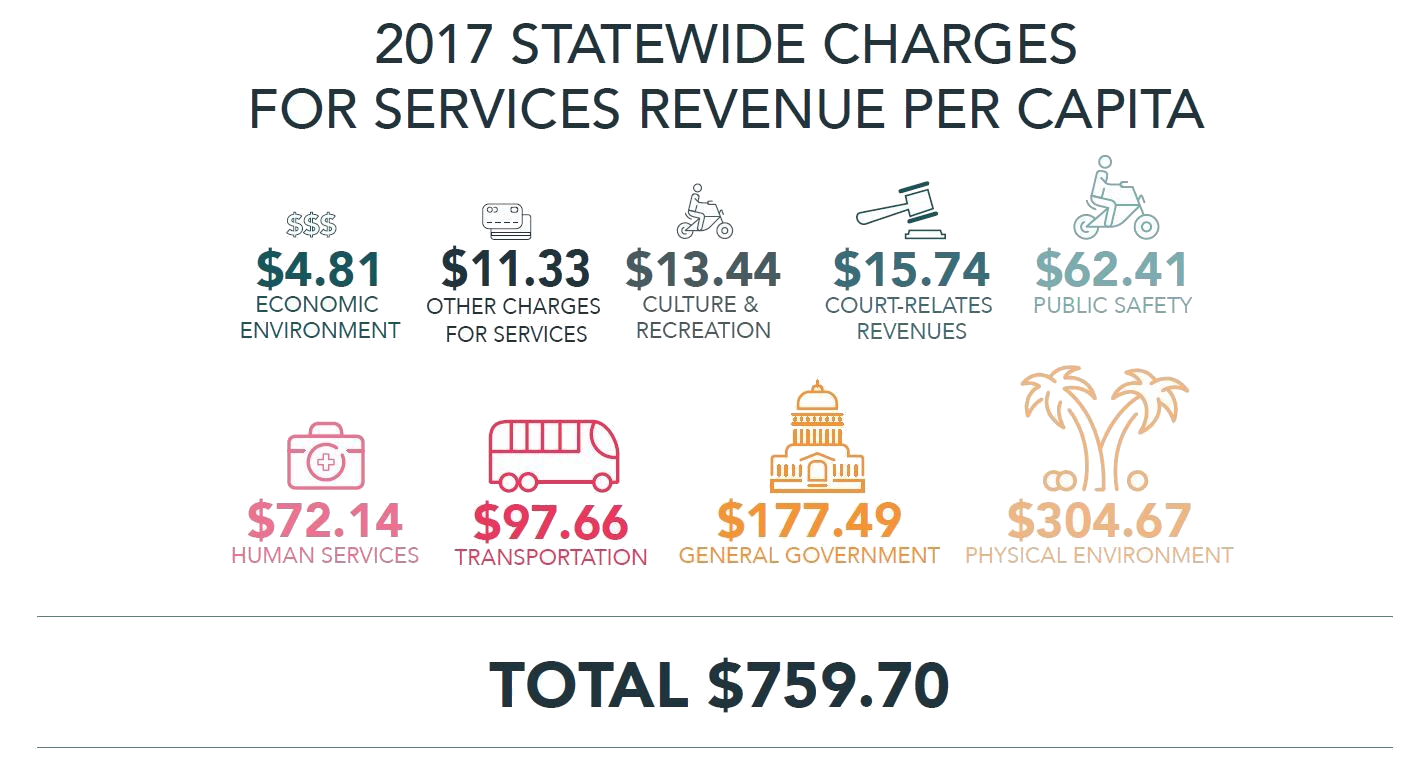
In FY 2017, Charges for Services accounted for 33.59% of all statewide revenues for Florida’s counties, the largest revenue category. The statewide average percentage share was equal to 20.10%, when comparing Charges for Services revenue to all revenues on a county-by-county basis. The total per capita receipts for Charges for Services revenue was equal to $759.70 per person statewide.
In FY 2017, Charges for Services accounted for 33.59% of all statewide revenues for Florida’s counties, the largest revenue category. The statewide average percentage share was equal to 20.10%, when comparing Charges for Services revenue to all revenues on a county-by-county basis. The total per capita receipts for Charges for Services revenue was equal to $759.70 per person statewide.
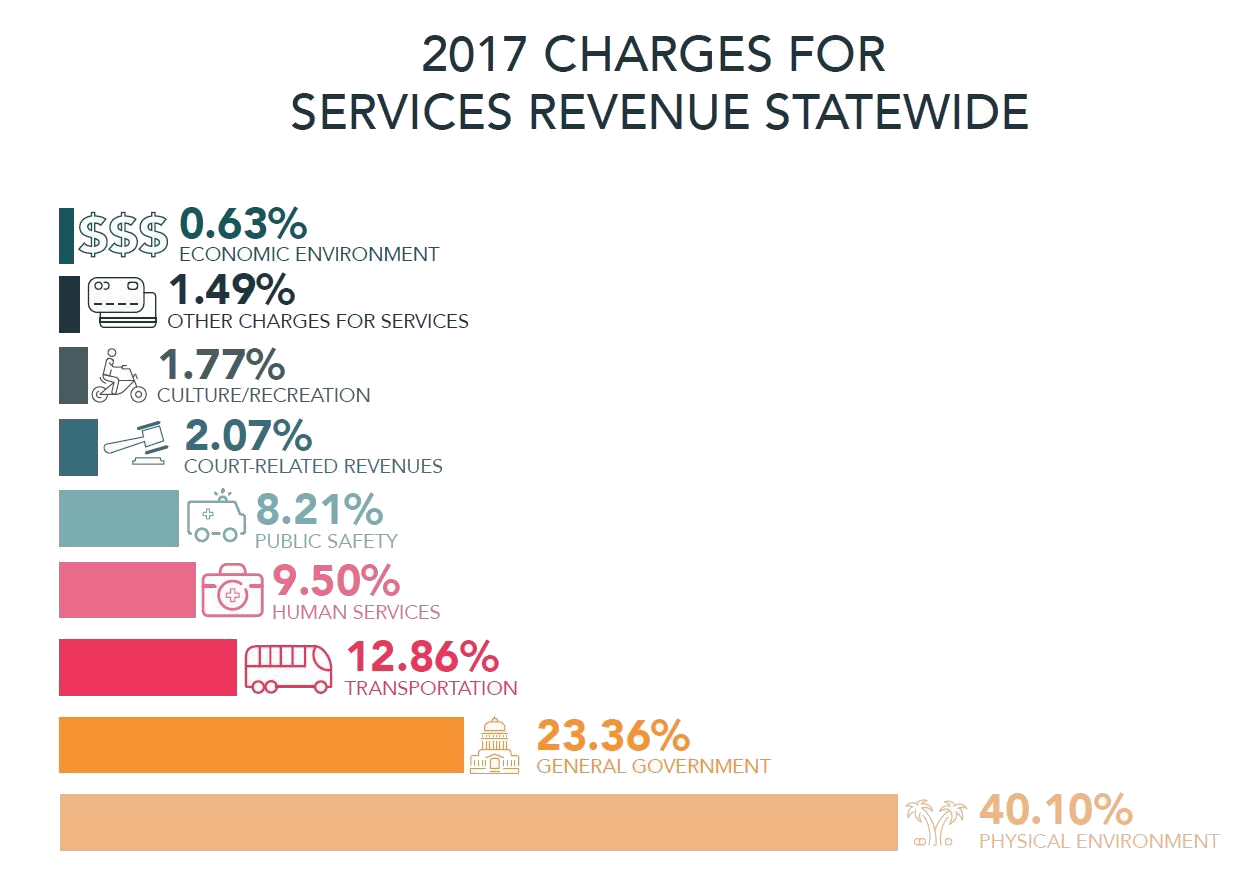
The majority of Charges for Services receipts were concentrated within three revenue categories: Physical Environment, General Government, and Transportation. These three revenuecategories accounted for about 76% of total Charges for Services revenues, $579.82 in per capita revenues for FY 2017.
About two-fifths of all Charges for Services revenues collected (40.10%) were Physical Environment revenues. The total per capita revenues for Physical Environment receipts was $304.67. Charges for Services revenues include charges for utilities such as electric, gas, water, sewer, and wastewater as well as cemetery fees and conservation and resource management.
General Government revenue accounted for the second highest revenue category at 23.26%, while Transportation revenues follow at 12.86% of statewide Charges for Services revenues. The total per capita receipts for General Government revenues was $177.49 and $97.66 for Transportation revenues.


General Government revenues are the result of charges for administrative services, clerk fees, documentary stamp taxes, and fees remitted to the county by constitutional officers such as the sheriff, clerk of court, tax collector, property appraiser, and supervisor of elections. Transportation revenues account for receipts associated with charges for airports, water ports, mass transit, railroads, parking facilities, and tolls such as those for roads, ferries, and bridges.
Human Services revenue accounted for the fourth highest revenue category at 9.5%, while Public Safety revenues follow at 8.21% of statewide Charges for Services revenues. The total per capita receipts for Human Services revenues was $72.14 and $62.41 for Public Safety revenues. Human Services revenues include health inspection, clinic, and animal control fees.
Human Services revenue accounted for the fourth highest revenue category at 9.5%, while Public Safety revenues follow at 8.21% of statewide Charges for Services revenues. The total per capita receipts for Human Services revenues was $72.14 and $62.41 for Public Safety revenues. Human Services revenues include health inspection, clinic, and animal control fees.
Public Safety revenues account for receipts associated with charges for housing prisoners, law enforcement services, protective inspection fees, fire protection, ambulatory services, and emergency management services.
The revenue categories of Court-Related Revenues, Culture & Recreation, Economic Environment and Other Charges for Services receipts collectively accounted for about 6% of the total Charges for Services revenues. The total per capita receipts for Court-Related Revenues, Culture & Recreation, Economic Environment and Other Charges for Services was $15.74, $13.44, $4.81, and $11.33 respectively.
The revenue categories of Court-Related Revenues, Culture & Recreation, Economic Environment and Other Charges for Services receipts collectively accounted for about 6% of the total Charges for Services revenues. The total per capita receipts for Court-Related Revenues, Culture & Recreation, Economic Environment and Other Charges for Services was $15.74, $13.44, $4.81, and $11.33 respectively.
