
2021 County Revenues & Expenditures: Physical Environment
Conservation and protection of Florida’s natural resources is critical to managing growth, promoting economic development, and maintaining a healthy environment to ensure a high quality of life for Floridians.
In FY 2018, Physical Environment expenditures accounted for $6,554,146,612, or 14.09% of all statewide expenditures for Florida’s counties, the fourth largest expenditure category. The statewide average percentage share was equal to 9.75%, when comparing Physical Environment expenses to all expenditures on a county-by-county basis. The total per capita spending for Physical Environment expenditures was equal to $314.49 per person statewide. This represents an increase of $329,188,167, or 5.29% from the previous fiscal year. The total per capita spending for Physical Environment expenditures increased by $10.60, or 3.49% from the previous fiscal year.
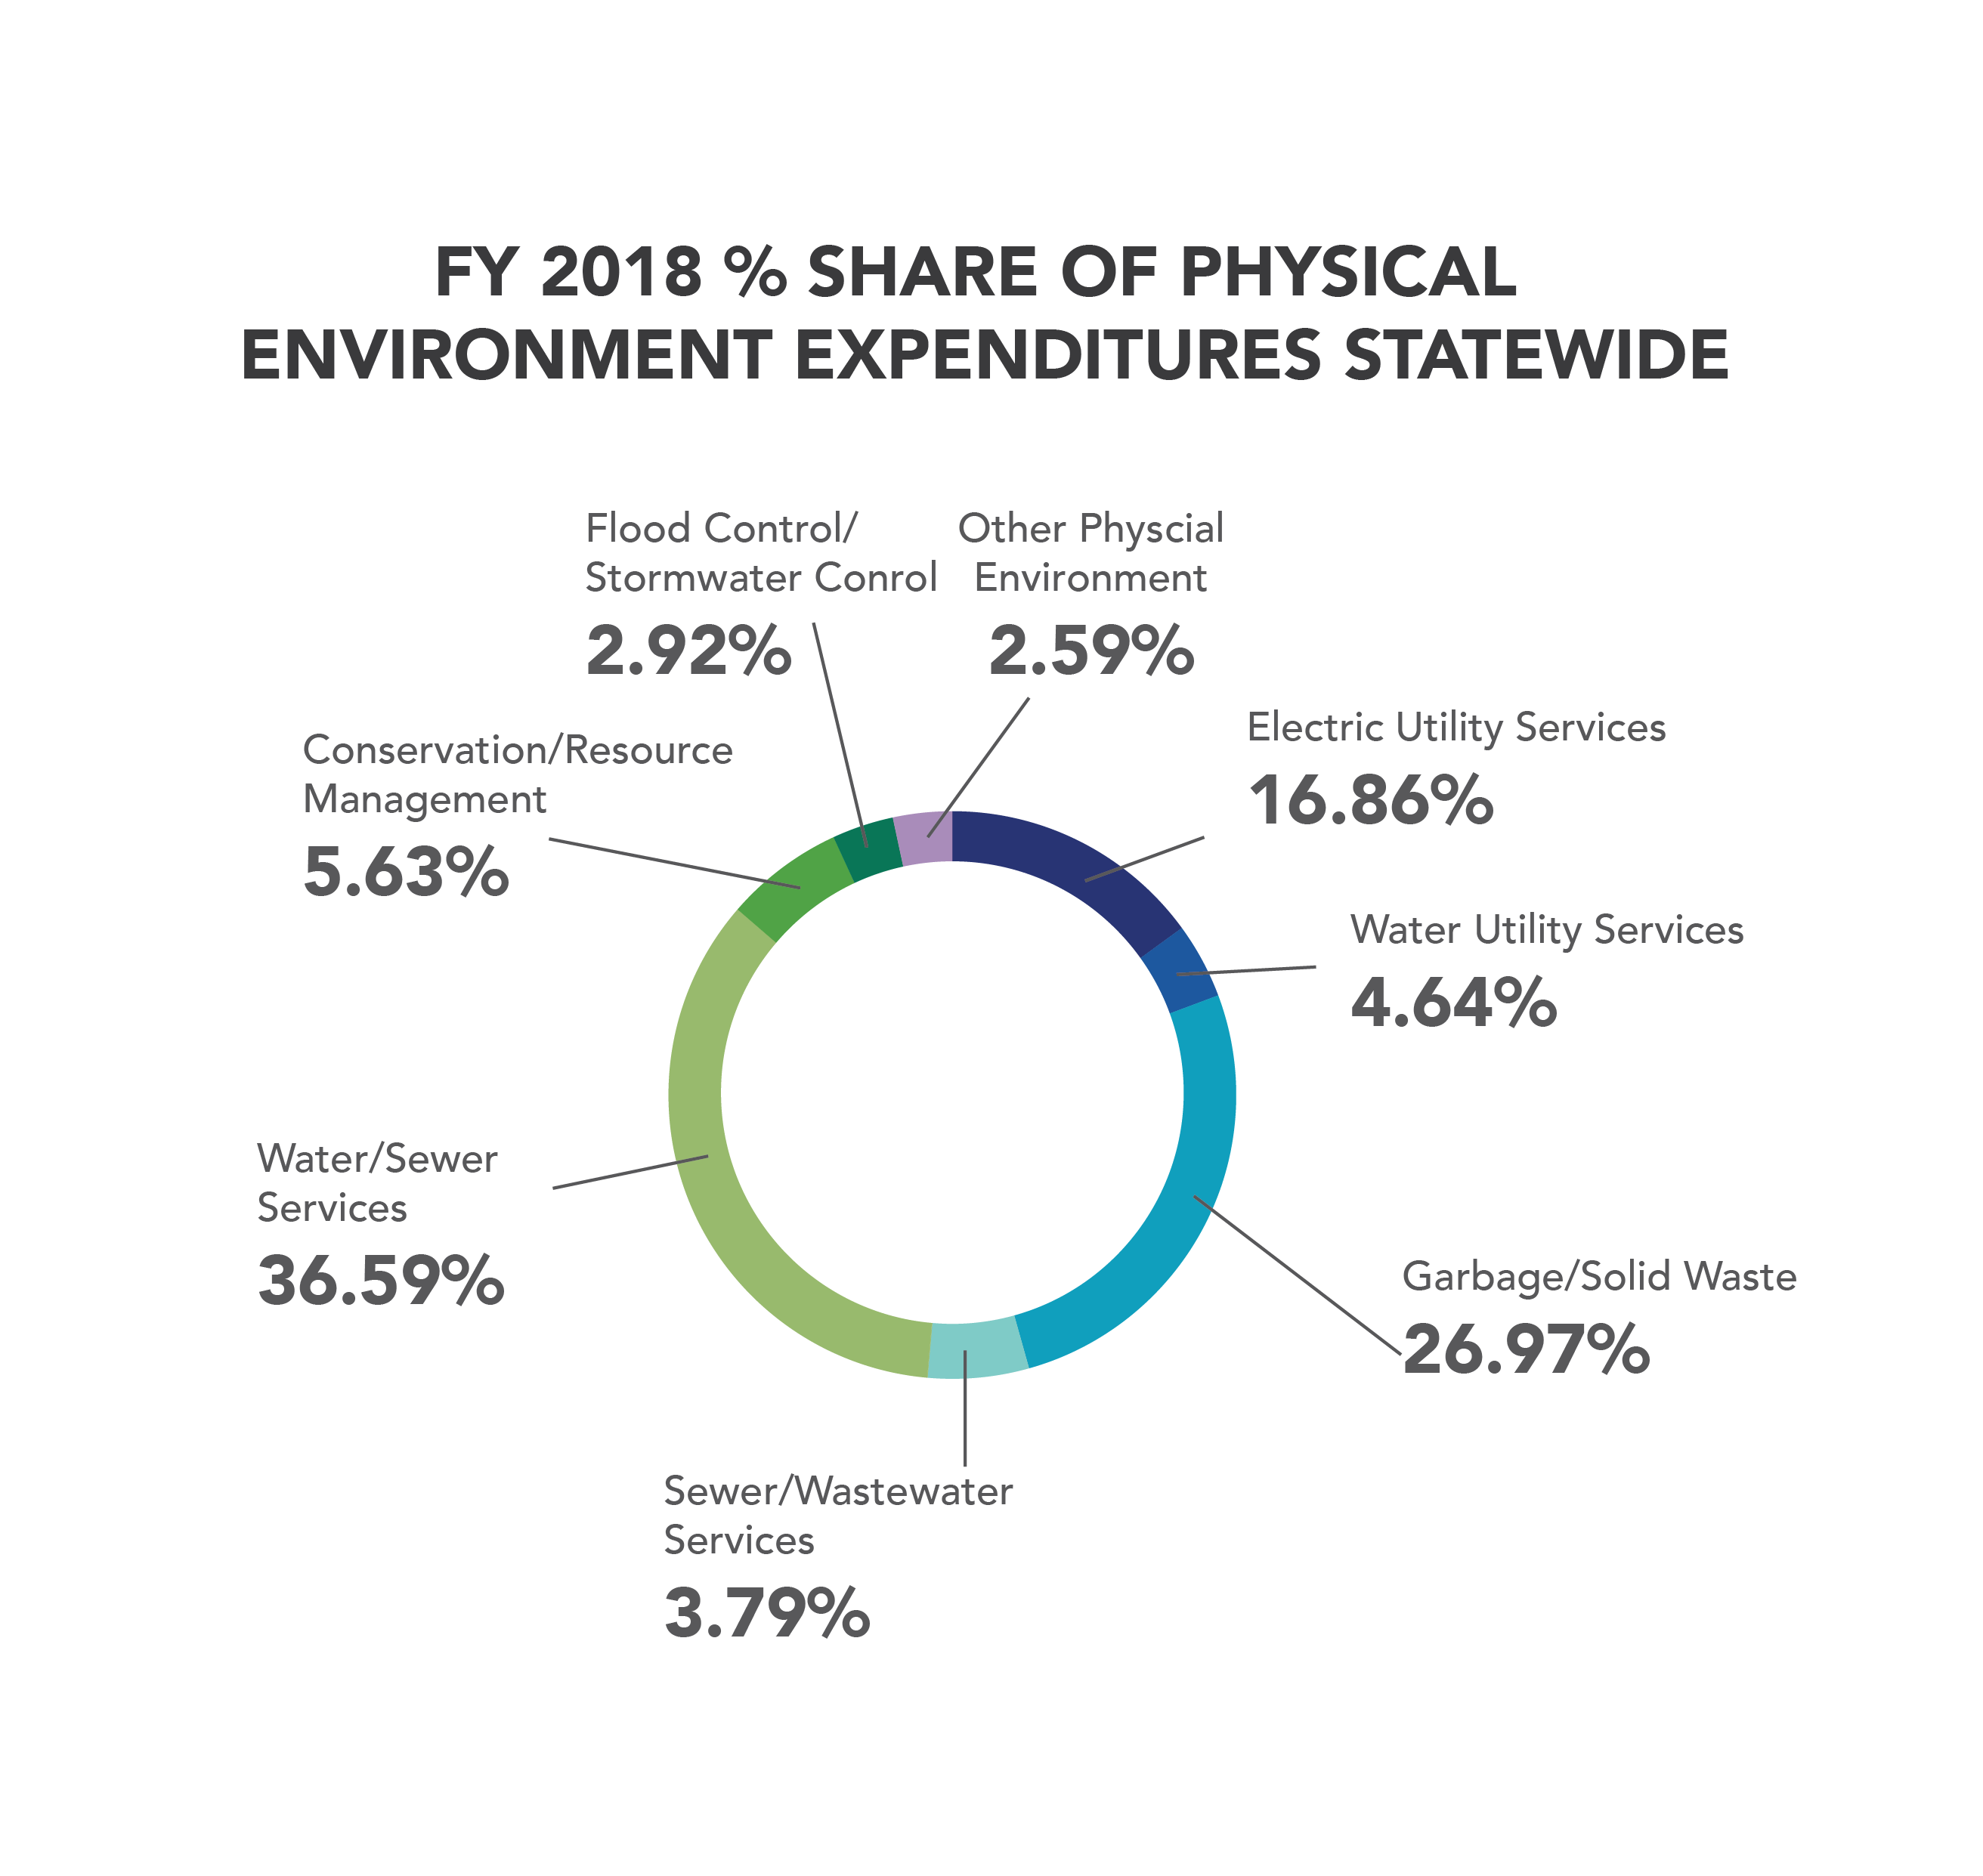
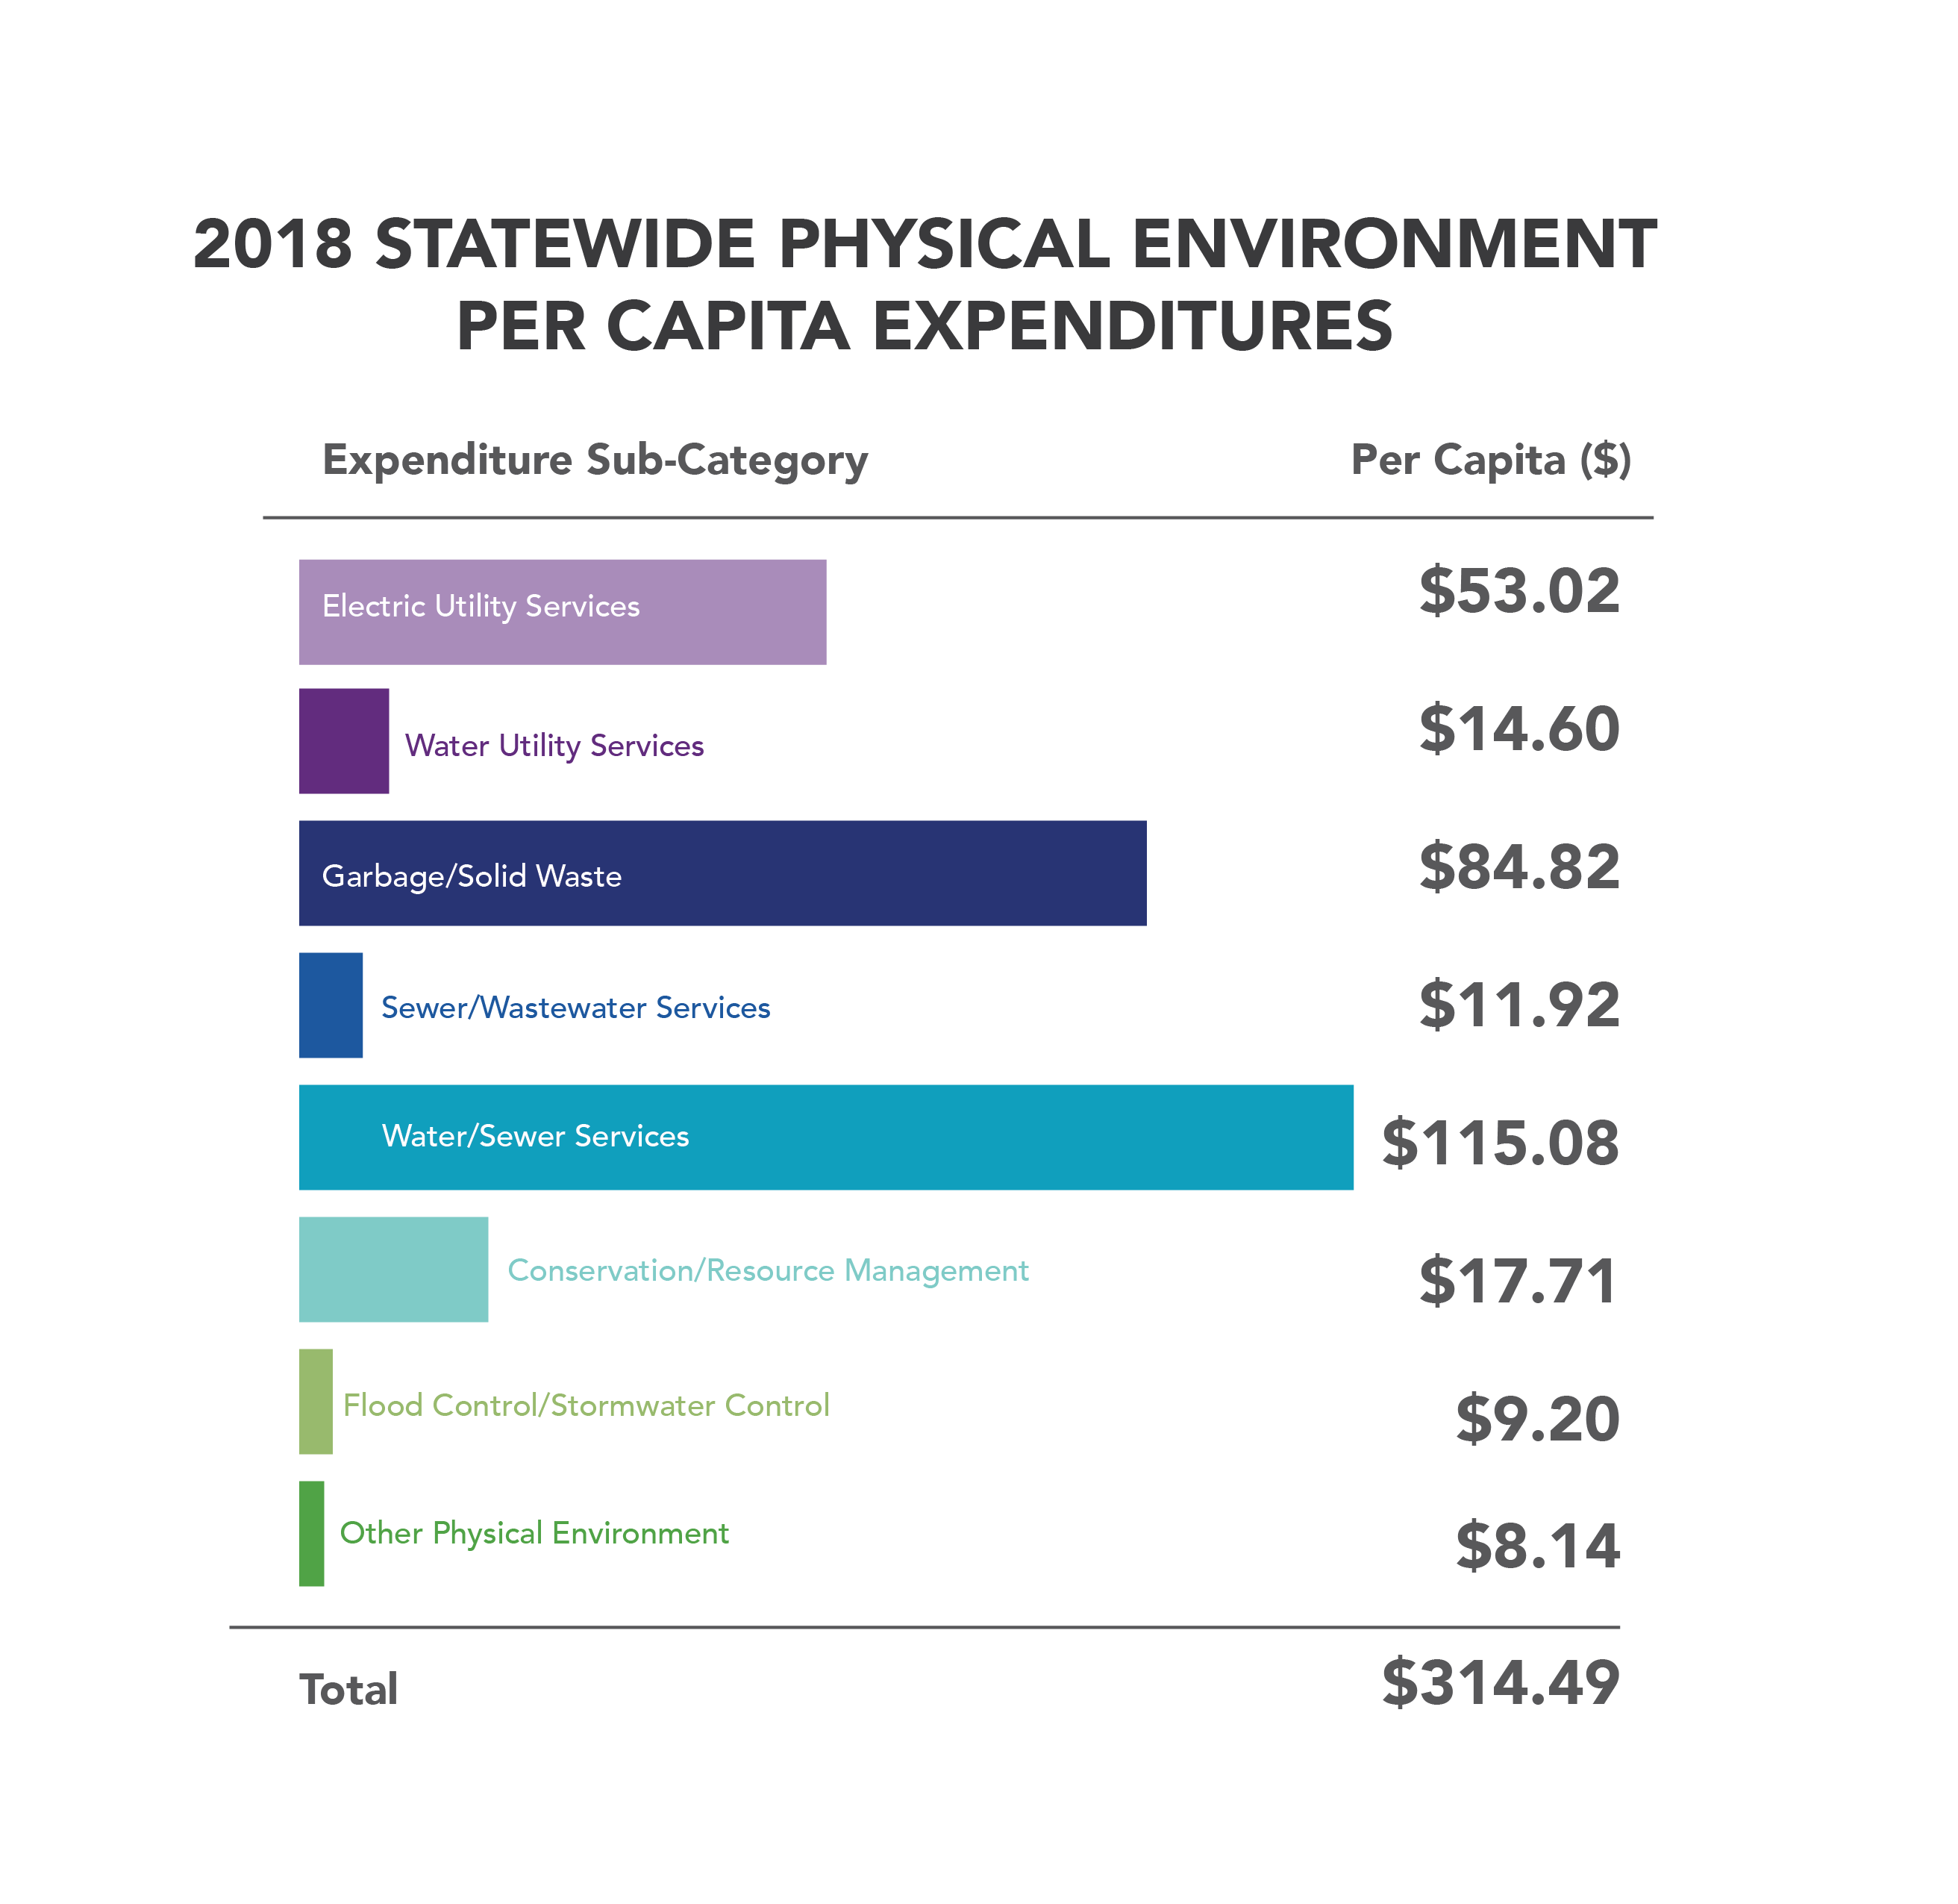
The majority of Physical Environment spending was concentrated within three expenditure categories statewide: Water/Sewer Services, Garbage/Solid Waste, and Electric Utility Services. These three categories accounted for about 80% of total Physical Environment spending, $252.92 in per capita expenditures for FY 2018.
Almost half of all Physical Environment expenditures (45.04%) were spent on Water related expenditures, which includes Water/ Sewer Services, Water Utility Services, and Sewer/Wastewater Services. The total per capita spending for all Water related expenditures was $141.60. Water/Sewer Services expenditures ensure that local governments deliver a reliable source of water, treatment facilities, storage capacity, distribution network, and security measures to protect the infrastructure. Water/Sewer Services accounted for the highest expenditure category at 36.59% of statewide Physical Environment expenditures. The total per capita spending for Water/Sewer Services was $115.08. Water Utility Services statewide spending was the fifth highest expenditure category with a 4.64% share of total statewide expenditures and the per capita spending was $14.60. Sewer/Wastewater Services statewide spending was the third lowest expenditure category with a 3.79% share of statewide expenditures and the per capita spending was $11.92.
Almost half of all Physical Environment expenditures (45.04%) were spent on Water related expenditures, which includes Water/ Sewer Services, Water Utility Services, and Sewer/Wastewater Services. The total per capita spending for all Water related expenditures was $141.60. Water/Sewer Services expenditures ensure that local governments deliver a reliable source of water, treatment facilities, storage capacity, distribution network, and security measures to protect the infrastructure. Water/Sewer Services accounted for the highest expenditure category at 36.59% of statewide Physical Environment expenditures. The total per capita spending for Water/Sewer Services was $115.08. Water Utility Services statewide spending was the fifth highest expenditure category with a 4.64% share of total statewide expenditures and the per capita spending was $14.60. Sewer/Wastewater Services statewide spending was the third lowest expenditure category with a 3.79% share of statewide expenditures and the per capita spending was $11.92.
Garbage/Solid Waste expenditures accounted for the second highest expenditure category at 26.97% of statewide Physical Environment expenditures. The total per capita spending for Garbage/Solid Waste expenditures was $84.82. Garbage/Solid Waste expenditures account for costs associated with providing for the collection and disposal of garbage, refuse and solid wastes.
While Electric Utility Services statewide spending was the third highest expenditure category with a 16.86% share of total statewide expenditures and total per capita spending was $53.02, it must be noted that only 4 counties experienced any expenditure in this category. Of those 4 counties, Duval/City of Jacksonville accounted for 99.93% of the total Electric Utility Services expenditures statewide. Conservation/Resource Management was the fourth highest expenditure category at 5.63%. The total per capita spending for Conservation/ Resource Management was $17.71. Conservation/Resource Management expenditures account for costs associated with the maintenance of counties natural resources. The expenditure categories of Flood Control/ Stormwater Control and Other Physical Environment spending collectively accounted for 5.51% of the total Physical Environment expenditures. The total per capita spending for Flood Control/Stormwater Control and Other Physical Environment was $9.20 and $8.14 respectively.
While Electric Utility Services statewide spending was the third highest expenditure category with a 16.86% share of total statewide expenditures and total per capita spending was $53.02, it must be noted that only 4 counties experienced any expenditure in this category. Of those 4 counties, Duval/City of Jacksonville accounted for 99.93% of the total Electric Utility Services expenditures statewide. Conservation/Resource Management was the fourth highest expenditure category at 5.63%. The total per capita spending for Conservation/ Resource Management was $17.71. Conservation/Resource Management expenditures account for costs associated with the maintenance of counties natural resources. The expenditure categories of Flood Control/ Stormwater Control and Other Physical Environment spending collectively accounted for 5.51% of the total Physical Environment expenditures. The total per capita spending for Flood Control/Stormwater Control and Other Physical Environment was $9.20 and $8.14 respectively.