
Providing for public safety is one of the core functions of county governments. Counties provide for safety through support of first-responder services from sheriffs’ offices, ambulance services, fire and rescue, and emergency management centers that protect the public during natural or man-made disasters, terrorism, emergencies, and public health threats.
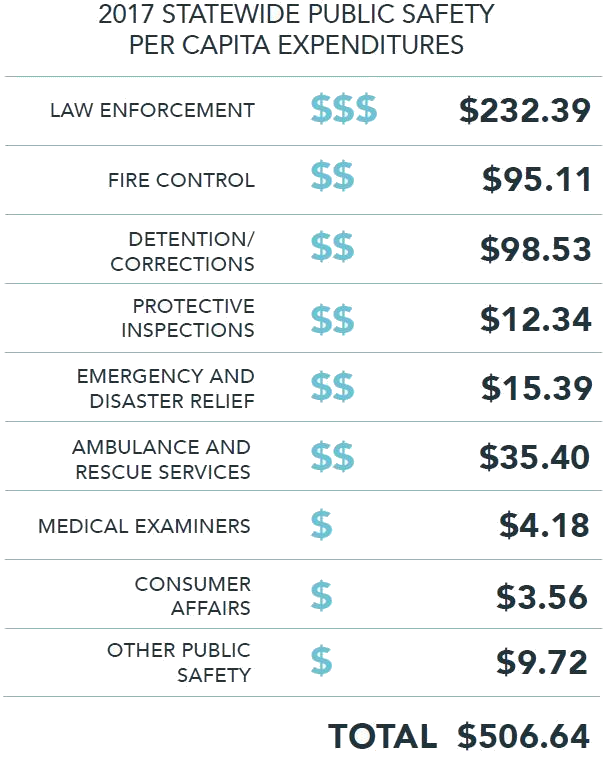
In FY 2017, Public Safety expenditures accounted for 23.48% of all statewide expenditures for Florida’s counties, the single largest expenditure category. The statewide average percentage share was equal to 29.88%, when comparing Public Safety expenses to all expenditures on a county-by-county basis. The total per capita spending for Public Safety expenditures was equal to $506.64 per person statewide.
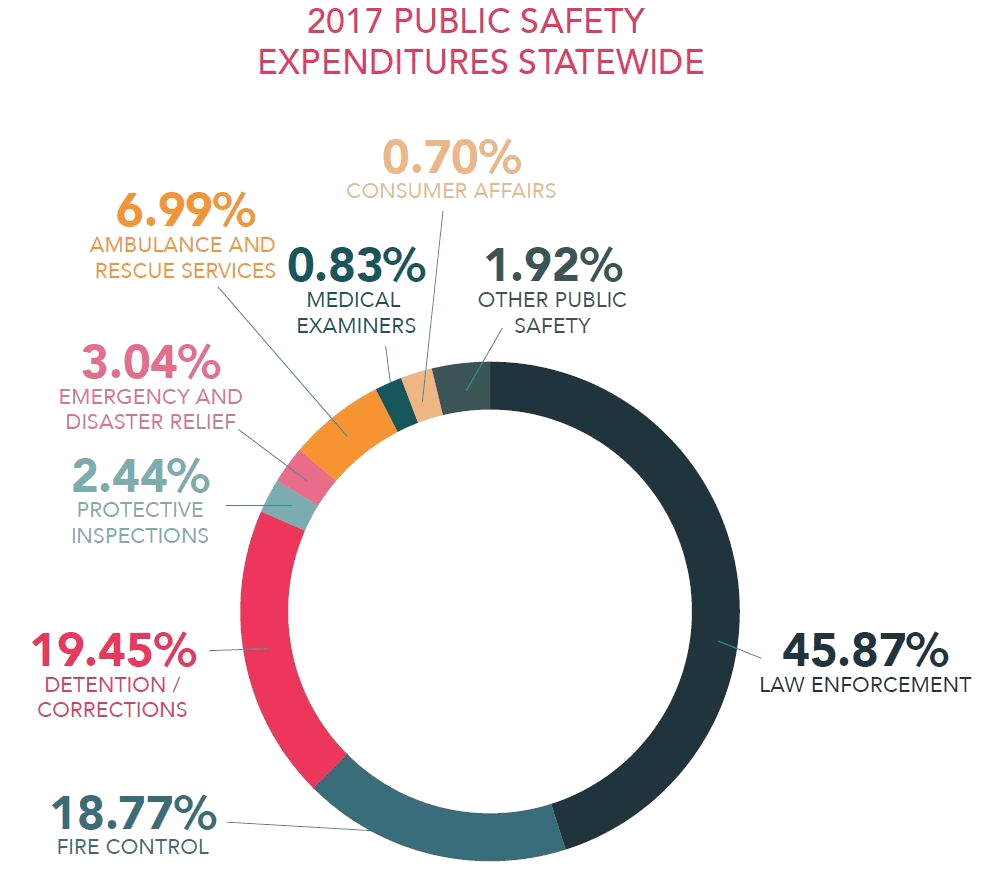
The majority of Public Safety spending was concentrated within three expenditure categories statewide: Law Enforcement, Detention and Corrections, and Fire Control. These threecategories accounted for about 84% of total Public Safety spending, $426.03 in per capita expenditures for FY 2017.
Nearly half of all Public Safety expenditures (45.87%) were spent on Law Enforcement services. The total per capita spending for Law Enforcement expenditures was $232.39. Specifically, these expenditures account for Sheriff personnel, operating, and capital costs.
Detention and Corrections expenditures accounted for the second highest expenditure category at 19.45%, while Fire Control expenditures follow at 18.77% of statewide Public Safety expenditures. The total per capita spending for Detention and Corrections expenditures was $98.53 and $95.11 for Fire Control.
Detention and Corrections sources primarily consist of housing and rehabilitation costs of corrections programs including parole & probation, facilities, juvenile programs, and work release programs. Fire Control sources consist of all fire-related costs including fire departments, fire districts, and fire control services.
Ambulance and Rescue Services expenditures account for all costs related to the transport of the sick and injured for care services. These costs equaled the fourth highest expenditure category with a 6.99% share of total statewide Public Safety expenditures. The total per capita spending for Ambulance and Rescue Services was $35.40.
Emergency and Disaster expenditures, which account for natural disaster spending and relief as well as emergency communications systems, typically averaged less than 3% of overall county Public Safety expenditure totals. The exception to this average were those counties impacted by Hurricanes Hermine (FY 2016) and Matthew (FY 2016). The total per capita spending for Emergency and Disaster was $15.39.
The expenditure categories of Protective Inspections, Medical Examiners, Consumer Affairs, and Other Public Safety spending collectively accounted for 5.88% of the total Public Safety expenditures. The total per capita spending for Protective Inspections, Medical Examiners, Consumer Affairs, and Other Public Safety was $12.34, $4.18, $3.56, and $9.72 respectively.